13 Country Report: Data Visualization
maher196


Since December 2021, wildfires have been devastating northeastern Argentina, including Iberá National Park. A severe drought began in November due to La Niña and unprecedented high temperatures. It is vital to study the history of wildfires in Argentina in order to better understand the causes and how best to mitigate current and future fires.
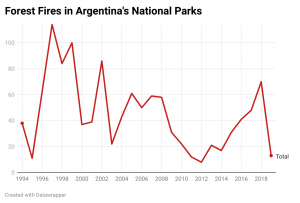
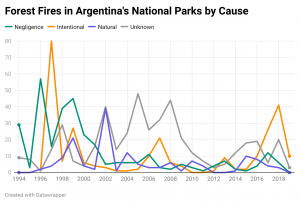
I chose to use line graphs to represent both the total number of wildfires in national parks and the number by each of four causes in the period 1994-2019. Line graphs are useful for looking at trends over time and to correlate the data to what else could have been going on at the time/over a period of time. It is easy to define periods of increase and decrease (since line graphs show direction) as well as maxima and minima.
Citations
(2020). Causas y cantidad de incendios en parques nacionales (datos.gob.ar; Version 2.6.3)[Data set]. datos.gob.ar. https://datos.ambiente.gob.ar/dataset/12f60bea-3225-4375-935c-1fb9ebe3ef57/resource/6c3a726b-f2d0-43d4-81ac-72e55a84a6a3/download/incendios-cantidad-causas-parques-nacionales.csv.
Pratt, Sara E. (n.d.). Wildfires Ravage Corrientes, Argentina. Earth Observatory. https://earthobservatory.nasa.gov/images/149478/wildfires-ravage-corrientes-argentina.