225 Country Report: Data Visualization
Alanna Strickland
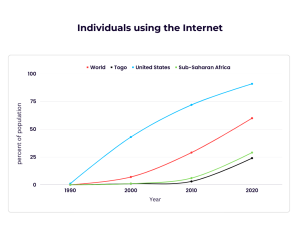
I chose this visualization to highlight the growth over the decades of internet access in Togo to show a more concise image of change. I made sure to add other countries, continents, and world statistics so people can understand how slow or fast the growth is for Togo. In comparing it to the world, you can see it fall behind. In comparing it to the United Staes, a high-income country, you can see that if falls drastically behind. Finally, in comparing it to the region it is in with countries that are similar to itself, it shows an almost equally amount of growth but, it still falls behind. Below is the data sources from which I got my information.
Bank, W. (2020). Individuals using the internet (% of population) – sub-saharan africa. Data. Retrieved March 2, 2023, from https://data.worldbank.org/indicator/IT.NET.USER.ZS?locations=ZG
Bank, W. (2020). Individuals using the internet (% of population) – togo. Data. Retrieved March 2, 2023, from https://data.worldbank.org/indicator/IT.NET.USER.ZS?locations=TG
Bank, W. (2020). Individuals using the internet (% of population) – united states. Data. Retrieved March 2, 2023, from https://data.worldbank.org/indicator/IT.NET.USER.ZS?locations=US
Bank, W. (2020). Individuals using the internet (% of population). Data. Retrieved March 2, 2023, from https://data.worldbank.org/indicator/IT.NET.USER.ZS