5 User-Defined Functions
All program examples that have been presented up to this point have been in the form of a “script”, which is a largely unstructured code sequence in a single file. That is sufficient for short, simple programs. For larger, more complex programs, there are advantages to a modular approach, in which the code is divided into components, each of which performs a task that makes up a portion of the overall algorithm. In early programming languages, these units of code were sometimes called subroutines or procedures; in modern languages they are often called methods. In MATLAB, they are called functions.
Some of the benefits of a modular program design include:
- easier testing, debugging and maintenance
- more compact and readable code
- facilitation of teamwork
This chapter introduces the basics of writing a user-defined function in MATLAB. Chapter 8 explores the concept of program structure in more detail.
Lecture Video 5.1 – Introduction to User-Defined Functions
5.1 Relationship of a Function to a Main Program
It is common for a program to perform a given operation numerous times. Rather than duplicate the code to perform that task, it can be incorporated into a function, which is called repeatedly. In fact, the scripts that we have presented previously contained many function calls. For example, in this script, every line is actually a function call:
x = linspace (-5, 5, 100);
y = 2.5*sin(4*pi*x);
figure()
plot (x,y)
xlabel('x values')
ylabel('y values')
title ('sine function')
linspace, sin, figure, plot, xlabel, ylabel, and title are all functions that are included in MATLAB. Some, like linspace, are actually written in ordinary MATLAB code, while others, like plot, are implemented in lower-level code. The former type is called a library function, and the latter type is called a built-in function. If there is no MATLAB function to perform a task, a user can write a user-defined function, which can be called from various programs just like any other function.
Most function calls, like those in the previous example, have certain elements in common. The general form of a function call is
outputs = function_name (inputs)
Consider the first line of the script:
x = linspace (-5, 5, 100);
The name of the function, linspace, appears just to the right of the equals sign; the output, x, appears to the left of the equal sign; the inputs, -5, 5, 100, are enclosed within parentheses after the function name. The meaning of those values depends on how the function is defined. In the case of a MATLAB built-in or library function, you must refer to the documentation to determine what value(s) to pass to the function and in what order, and what output(s) it returns. The first step in creating a user-defined function is to define its inputs and outputs.
Notice that not all functions return an output – for example, xlabel, ylabel, and title. There are some functions, like figure, that do not always require an input.
5.2 Defining a Function
In this chapter, all user-defined functions will be external functions – that is, each function will be in a separate file, and the name of the file must match the name of the function. In this chapter we will assume that the program is structured as follows:
- A script file serves as the main program, which calls one or more external functions
- Each external function resides in a separate file in the same folder as the script
Chapter 8 shows some other ways that modular programs can be organized.
To see the structure of a user-defined function, consider the standard MATLAB function, linspace, which is reproduced below. This function uses many MATLAB features that are covered in later chapters. The key points are highlighted in the comments on the pdf. The most important ones to take note of are:
- The file name (linspace.m) matches the name of the function (
linspace). (If they do not match, MATLAB recognizes the function by the filename, regardless of the name given in the function definition line.) - A function definition always begins with the word
function. In an external function, there must be no code before this function definition line, although there can be comments - The input values are passed to the function by the caller (main script) through its input arguments. Comparing the list of input arguments (
d1,d2, n) with the input values (-5, 5, 100) in the function call in the example above, the values of these variables ared1 = -5,d2 = 5, andn = 100for this execution of the function - At some point in the body of the function, the output argument (
y) is assigned a value (an array of values in this case). That determines what is returned by the function. Unlike other languages, no return statement is required.
There is one more point that is worth reiterating – the main reason for writing a function is so that this lengthy block of code does not have to be repeated every time it is used. Instead, only a single line is needed to call the function each time.
Checkpoint 5.1: Function Call
Lecture Videos 5.2-5.4 – Writing and Calling Functions
Checkpoint 5.2 – user-defined function definition
Checkpoint 5.3 – user-defined function call
5.3 Passing by Value
It is important to understand how information is passed to and from a function; this is a topic that often confuses beginners. Consider the simple function defined below, which aims to perform the following operation:
Given a number, x
- if x is greater than 10, change it to 10
- if x is less than 0, change it to 0
- if x is between 0 and 10, round it to the nearest integer
An attempt at implementing this function is:
function limit_x (x)
disp("The initial value of x is " + x)
x = round (min (max(x,0), 10));
disp("x is now "+x)
end
A few calls to the function from the command line show that it is working as expected:
>> limit_x(11)
The initial value of x is 11
x is now 10
>> limit_x(-2)
The initial value of x is -2
x is now 0
>> limit_x(3.7)
The initial value of x is 3.7
x is now 4
All appears to be well, until we try calling this function from our main program as follows:
%script contains these lines to call the function
x = 12;
limit_x(x);
disp("x is now equal to "+x)
The output is now:
The initial value of x is 12
x is now 10
x is now equal to 12
Did the value of x somehow revert back to 12 when we returned to the main program? Not quite. In reality, there are two different variables called x – one in the function and one in the main program. Although these two variables happen to have the same name, they reside in two different locations in memory.
The fundamental idea that we are touching on is the scope of a variable. In MATLAB, a variable that is defined within a function is only valid while that function is executing – that is its scope. Similarly, a variable defined in the main script (if there is one – see Chapter 8) is only valid while the script is executing. Another way to put it is that each component – each function or the script – has its own workspace, and it cannot access the workspace of any other component.
If the function cannot access the main program’s variables, and vice versa, what is it that is being passed between them? It is only the value of those variables. For practical purposes, MATLAB uses a “pass by value” method; it does not support “pass by reference” as some other languages do. [1] In the above example, when the limit_x function is called, all that is passed to it is the number 12. If we want the main script to have access to the modified value of x, the function must pass it back through an output argument. The function definition line could be modified as follows:
function x = limit_x (x)
The function will then pass the final value of ITS variable x (10 in the last example) to the caller (the script). The function call must then be modified to store that value, either in the original variable, x, or a separate one. For example,
x = 12;
x = limit_x(x); %the variable x is overwritten with the value returned by the function
disp("x is now equal to "+x)The output when this program is run is:
The initial value of x is 12
x is now 10
x is now equal to 10
To avoid confusion, we could use different names for the variables in the script and the function. For example, modify the script as follows:
x1 = 12;
%pass the value of x1 to the function, which will store it in its x variable %the variable x2 is assigned the value returned by the functionx2 = limit_x(x1); disp("The modified value of x is "+x2)It is now clear that x1, x, and x2 are different variables with different values, at the cost of additional memory. If x were a large array, that would potentially be a major drawback that must be weighed against the improved clarity.
Checkpoint 5.4 – scope of a variable
5.4 Type Flexibility in MATLAB
Readers who have programmed in other languages may be wondering, how does MATLAB know the type and dimension of an input argument? The answer is, it doesn’t really care. Unlike strongly typed languages such as C or C++, MATLAB will allow you to pass any value through any input argument of a function (similarly to Python). It is up to you, the writer of the function, to make sure that the code can handle anything that is passed to it properly.
As an example, consider this function, which “doubles” its input argument. If the input is a number, double means to multiply by 2. If it is text, double means to append the string to itself.
function y = double_x (x)if isnumeric(x)y = 2*x;elseif ischar(x)y = [x x];elseif isstring(x)y = x+x;endend>> double_x(3.75)
ans =
7.5000
>> double_x('abc')
ans =
'abcabc'
>> double_x("def")
ans =
"defdef"
A similar issue arises for functions that are intended to accept arrays as inputs. Beginners often ask, “how do you tell MATLAB that the input is an array?” The answer is, you don’t. You simply write the function in a way that it will work if the input is an array or a scalar. The element-wise operators (.*, ./, and .^) are very useful for this. Consider this example, a function to calculate the parallel equivalent resistance of several resistors. The calculation to be performed is
[latex]\\[/latex]
[latex]R_{eq} = \frac{1}{\Sigma\ \frac{1}{R_i}}[/latex]
[latex]\\[/latex]
This can be implemented with array operations in a MATLAB function as follows:
[latex]\\[/latex]
function R_eq = parallel_resistance (R)
% R is a vector containing the resistance values
R_eq = 1/sum(1 ./ R);
end
[latex]\\[/latex]
The beauty of the element-wise operators is that they will work whether the operands are arrays or scalars, as illustrated by these example calls:
[latex]\\[/latex]
>> parallel_resistance(100)
ans =
100
>> parallel_resistance([100,100,100])
ans =
33.3333
5.5 Mathworks Resources
5.6 Problems
- Calculating Coin-flip Probability
factorial(). The function should take three input arguments: n, k, and p, and return one output argument, P.2. Simple String Parsing
-
- Last, First (e.g., ‘Toney, James’)
-
- Find the position of the comma using the
find()function. - Return the portion of the array from the first character to the one before the comma.
- Find the position of the comma using the
[latex]\\[/latex]
-
- A data matrix, where the first column contains the x-values, and each additional column contains the y-values for one data series
- A string array containing the names to use for the axis labels
- A string array containing the names to use for the legend
- A string to use for the title
-
- plot columns 2 through N (where N is the number of columns in the matrix) vs. column 1, all on the same graph. (There will be N-1 curves on the plot)
- use the provided strings to add the axis labels, legend and title
- scale the x and y axes so that they precisely span the range of values in the matrix (for the y-axis, the limits should go from the smallest value in any of the data series to the largest value in any of the data series – use the min and max functions with appropriate indexing).
d = [[1:100]', rand(100, 4)]; %generate 4 columns of random datamy_plot(d, ["x data", "y data"], ["y1", "y2", "y3", "y4"], "some random data")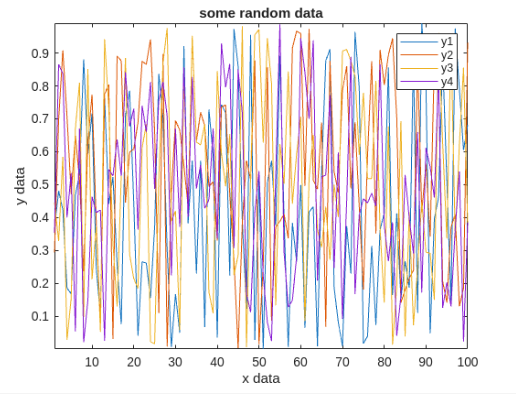
Find an error? Have a suggestion for improvement? Please submit this survey.
- It's actually a little more sophisticated than that - for example, MATLAB will avoid making a copy of an array that is passed to a function unless necessary. The important point is that a function cannot modify a variable in the main program's workspace. ↵
