Figures & Tables
Characteristics of Figures & Tables
- High quality (typically a resolution of at least 300 dpi) figures should be included in a poster so that the audience can easily read and understand the importance of the research.
- An audience will focus most of their attention on a poster’s figures and tables, therefore it is important to provide high-quality and informative figures and tables.
- Figures can be illustrations, images, diagrams, photographs, graphs, charts, plots and maps.
- Tables are used to communicate large amounts of data in a concise and effective manner.
Poster Figures
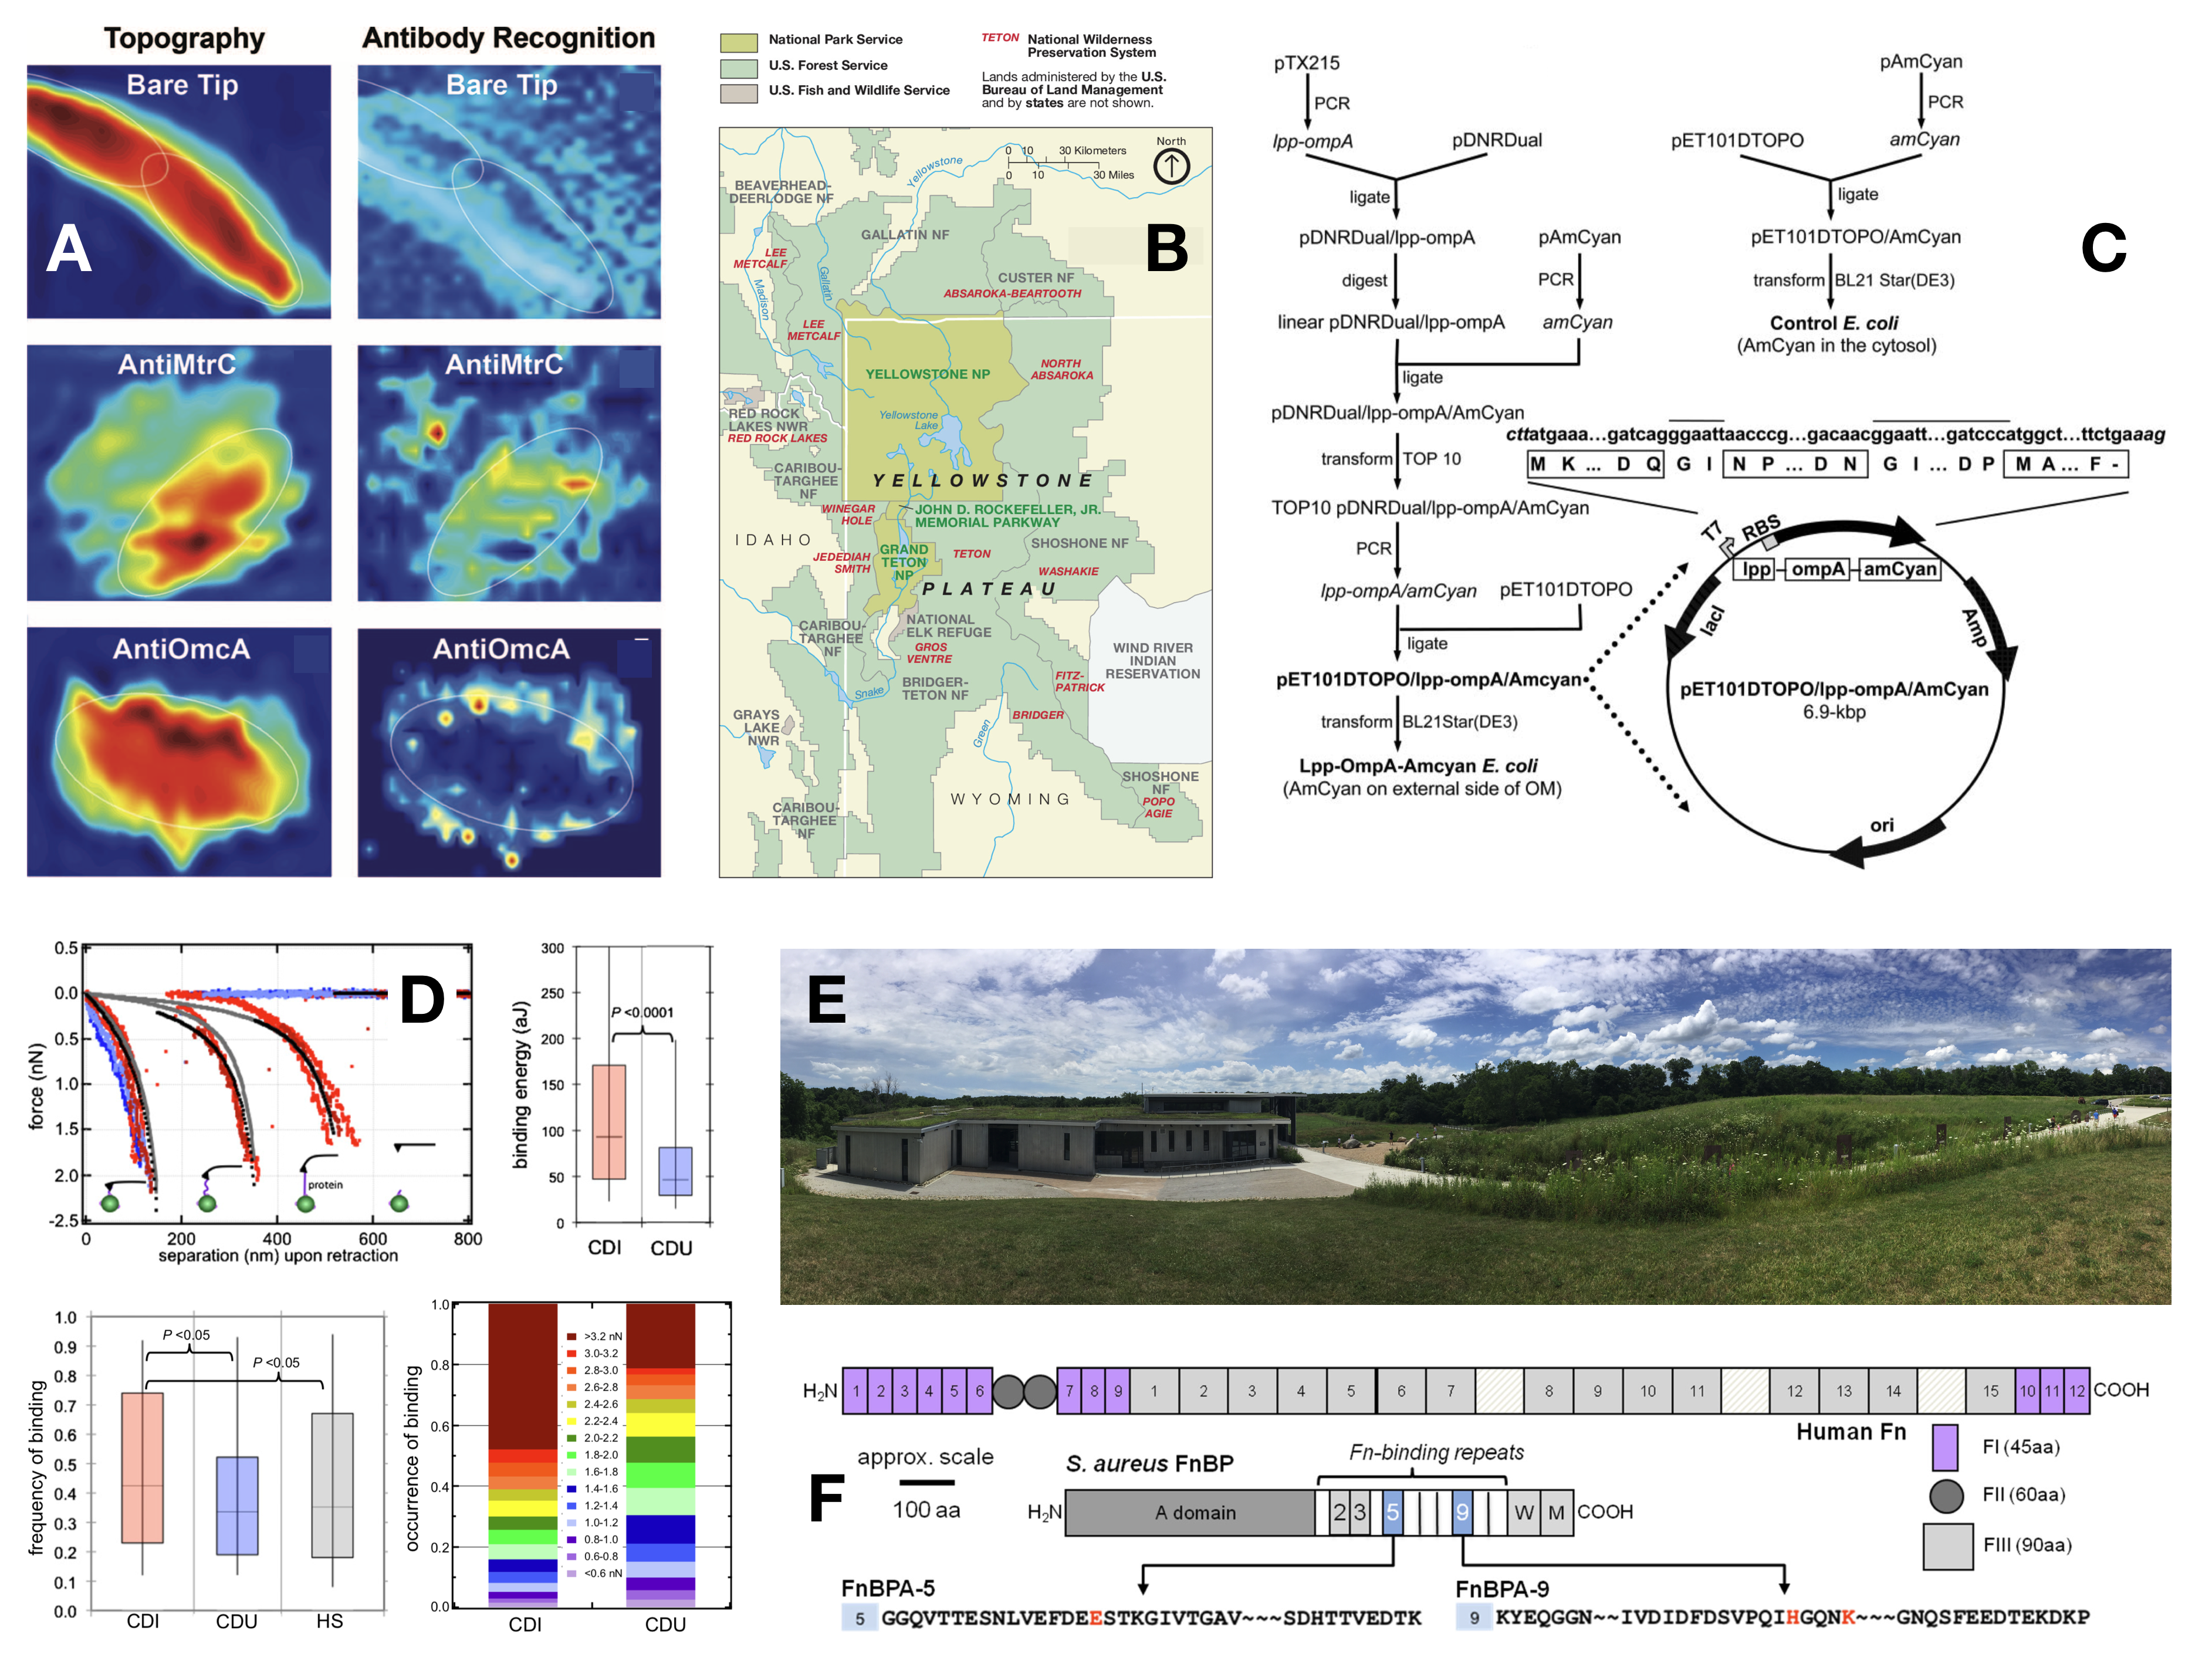
Figures (Fig. 16) are visual representations of data and information that allows an audience to better understand the research contained in a poster. A figure should always be accompanied by a caption that describes the information contained in the figure. Figures are important elements of all scientific posters and assist scientists in conveying research results and describing important details about their research topics. Figures can be illustrations, charts, graphs, maps, plots, diagrams and photographs. A scientific poster contains multiple figures (typically 4-10) used to describe the research data. However, there should not be so many figures that they take up the entire poster. Between 4-10 figures (or tables) is a reasonable number of figures (or tables) to include in a poster. The exact number will depend on the overall poster design and research objectives, which will be different for each presenter and each poster.
Figure 16. Different Types of Figures
Poster Figure Considerations
- Figures should be high quality and high-resolution images. A resolution of 300 dpi is typically recommended.
- You should include a variety of figures in your poster, such as photographs, images, graphs, maps, diagrams, charts, etc.
- It is encouraged that you include original figures that you designed, created or photographed.
- Each figure should include a a short title or header to label the figure.
- Each figure needs to be accompanied by a figure caption that describes the figure. Figure captions should be short (that is, typically less than 100 words) and descriptive.
- Each figure should contain a citation(s), which references the original source of data/information presented in the figure.
- Figures are used to engage an audience and capture their attention. This can be done through the use of color (as opposed to black and white), high-resolution images and photographs, visually stimulating presentations, or graphs and illustrations that explain complex information in a clean and simple manner.
Poster Tables
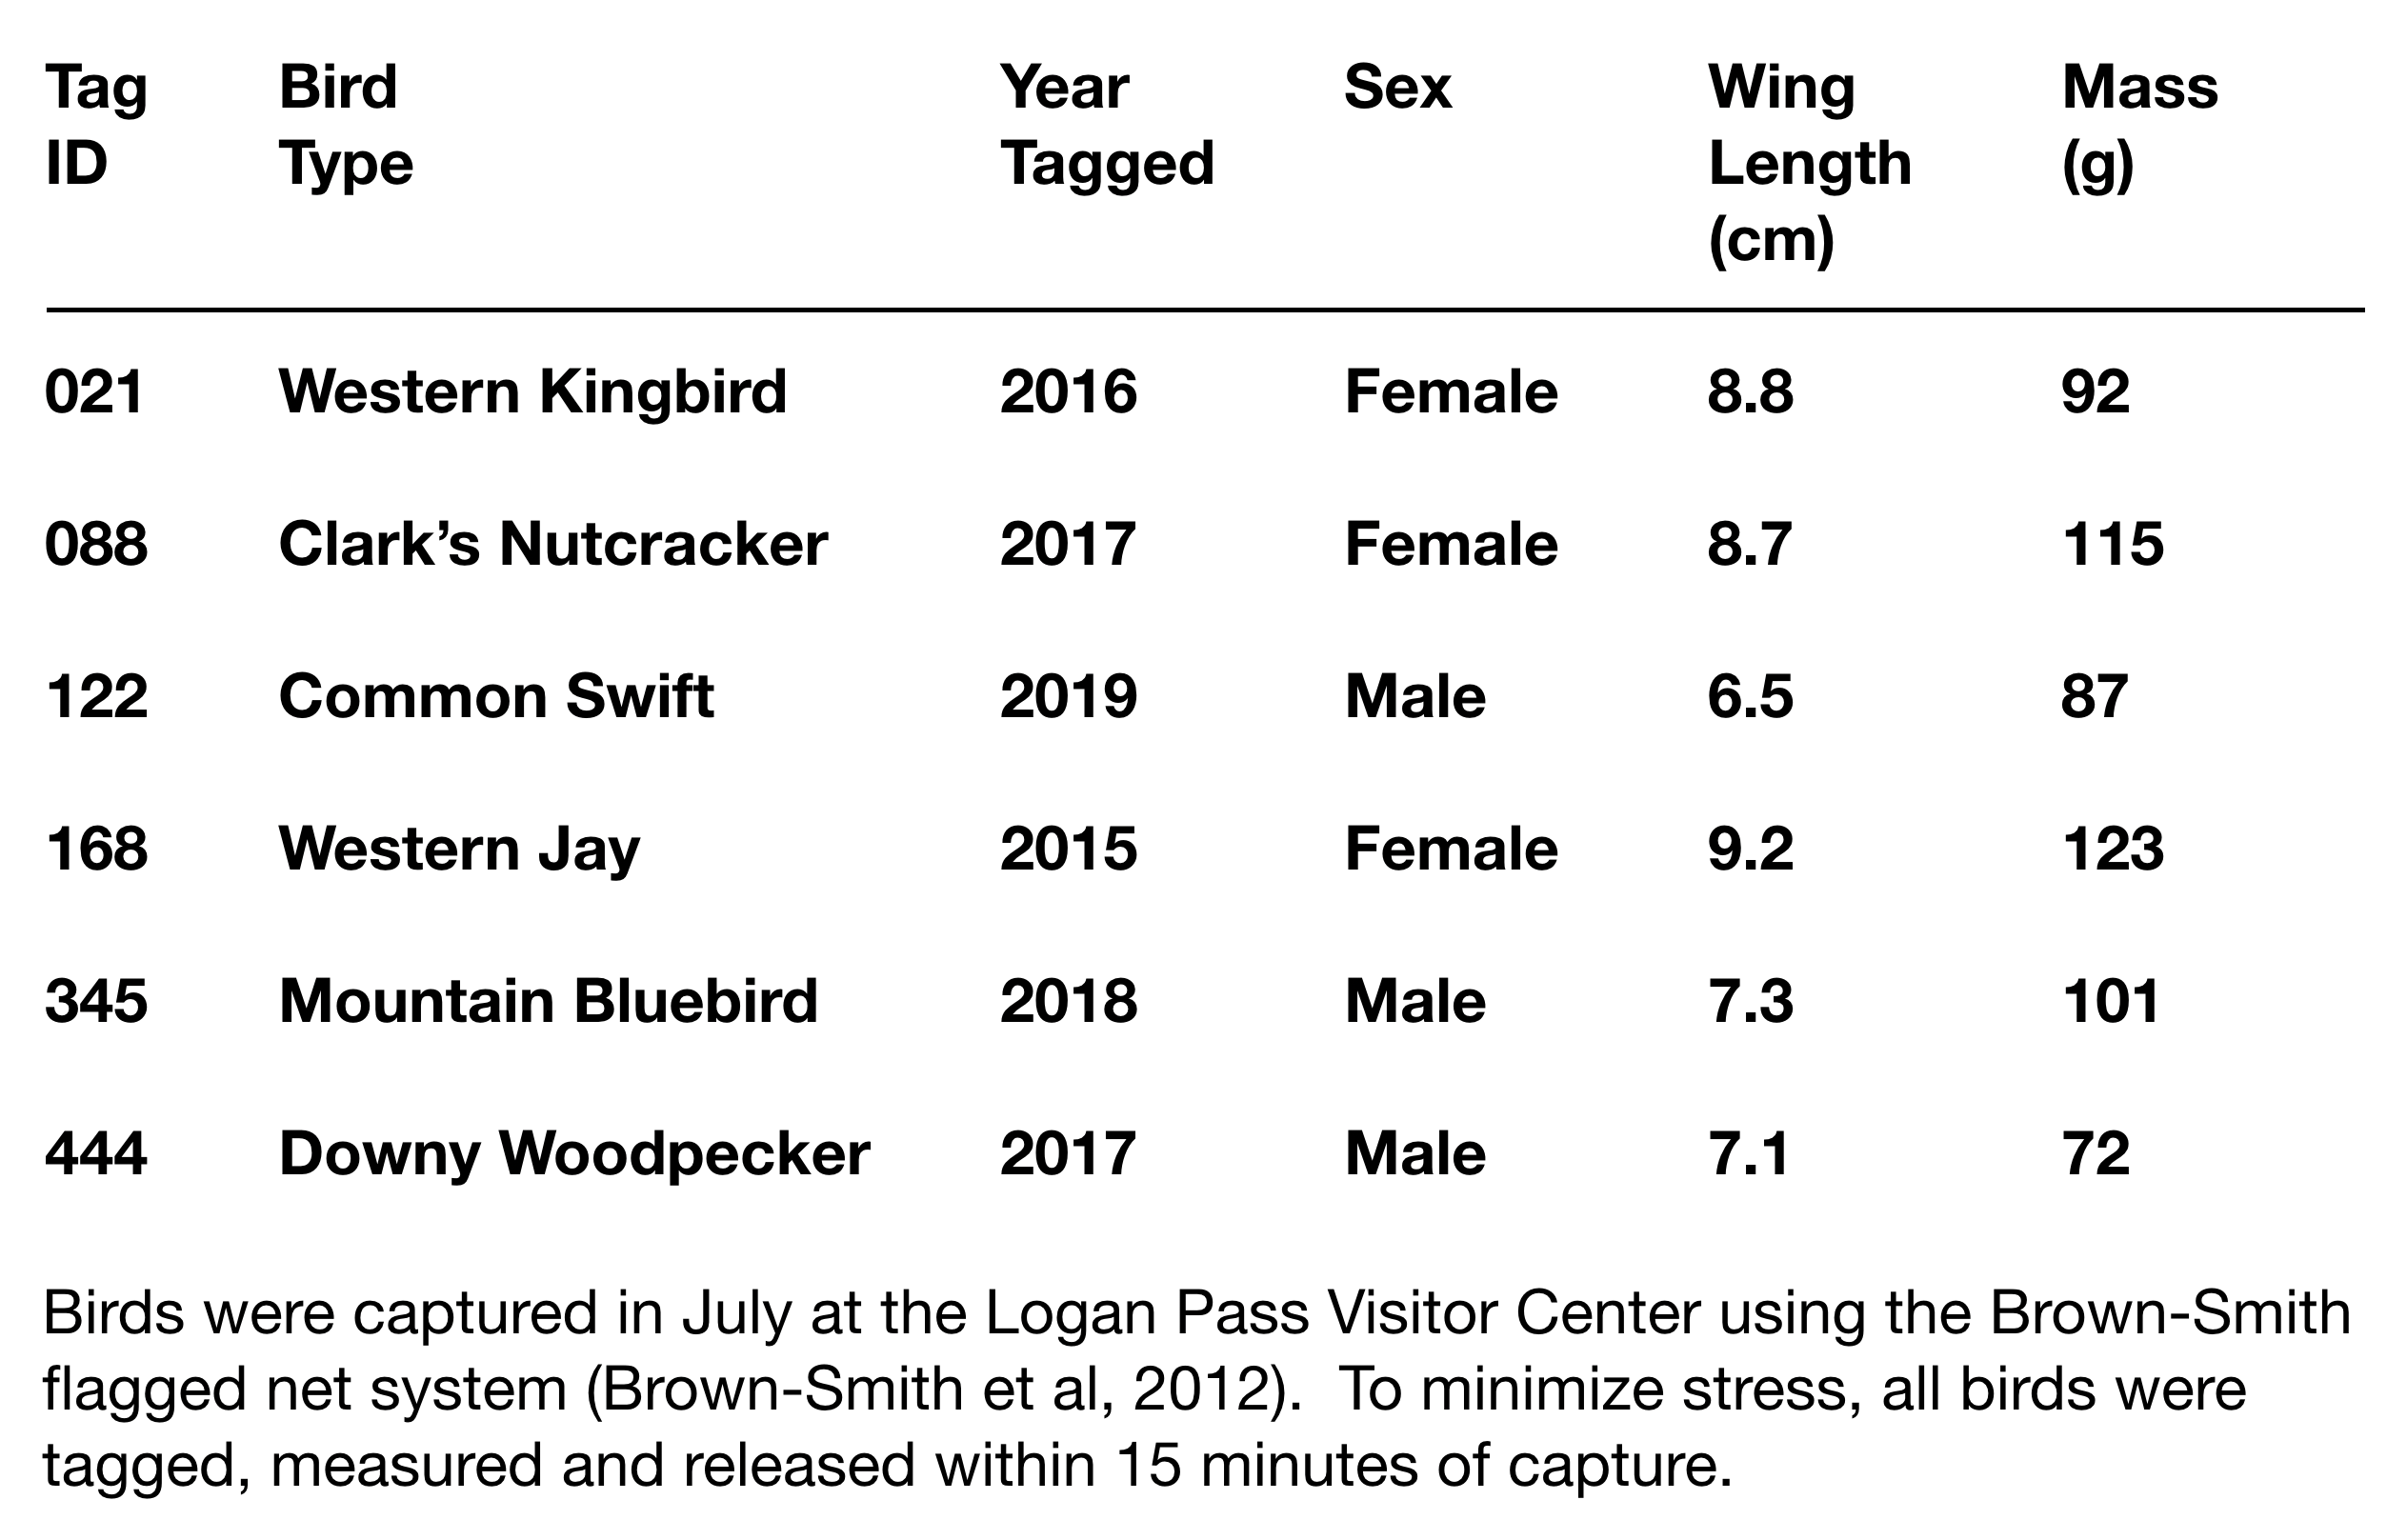
Tables are used to organize large amounts of data (e.g., numbers, information, observations) into rows and columns so that an audience can more easily understand the research (Table 3). Like a figure, a table is an important part of a scientific poster. It serves to communicate the importance of a particular data set or results to an audience. When viewing a poster, most people will be drawn to figures and tables first and they may not read the text contained in the body of a poster but rather focus all their attention presented in a poster’s figures and tables. Therefore, it is important that a table be designed and presented in a way that effectively communicates important data and results to the audience.
Table 3. Example Table of Individual Bird Banding in Glacier National Park from 2015-2019
Poster Table Considerations
- Tables should be clear, concise with data divided into well defined categories.
- Columns and rows should be spaced so that data contained within the table is easy to read.
- Units of measurement (e.g., kg, meters/second) should be included.
- A caption of 100 words or less, should accompany each table to explain the data and information contained within the table.
- Each table should contain a citation(s) that references the source of the information presented in the table.
- A minimum of 20-point font should be used in the table so that an audience can read from a distance of 2-3 feet (1 meter).
Image credits for Figure 16:
16A. Lower et al., 2009. Applied and Environmental Microbiology, 75(9): 2931-2935. 16B. Yellowstone National Park. 2016. Yellowstone Resources and Issues Handbook: 2016, Yellowstone National Park, Wyoming (USA). Available for free: www.nps.gov/yell. 16C. Lower et al., 2005. Journal of Bacteriology, 187(6): 2127-2137. 16D. Lower et al., 2011. Proceedings of the National Academy of Sciences (USA), 108(45): 18372-18377. 16E. B.H. Lower, 2019, Battelle Darby Creek Metro Park, Ohio (USA). 16F. Casillas-Ituarte et al., 2012. The Journal of Biological Chemistry, 287(9): 6693-6701.
