Results & Discussion
Characteristics of Results & Discussion
- Results section contains data collected by scientists from experiments that they conducted.
- Data can be measurements, numbers, descriptions and/or observations.
- Scientific data is typically described using graphs, tables, figures, diagrams, maps, charts, photographs and/or equations.
- Discussion section provides an interpretation of the data, especially in context to previously published research.
The Results and Discussion sections can be written as separate sections (as shown in Fig. 2), but are often combined in a poster into one section called Results and Discussion. This is done in order to (1) save precious space on a poster for the many pieces of information that a scientist would like to tell their audience and (2) by combining the two sections, it becomes easier for the audience to understand the significance of the research. Combining the Results section and Discussion section in a poster is different for what is typically done for a scientific journal article. In most journal articles, the Results section is separated from the Discussion section. Journal articles are different from posters in that a scientist is not standing next to their journal article explaining it to a reader. Therefore, in a journal article, an author needs to provide more detailed information so that the reader can understand the research independently. Separating the Results section and Discussion section allows an author the space necessary to write a lengthier description of the research. Journal articles typically contain more text and more content (e.g., figures, tables) than posters.
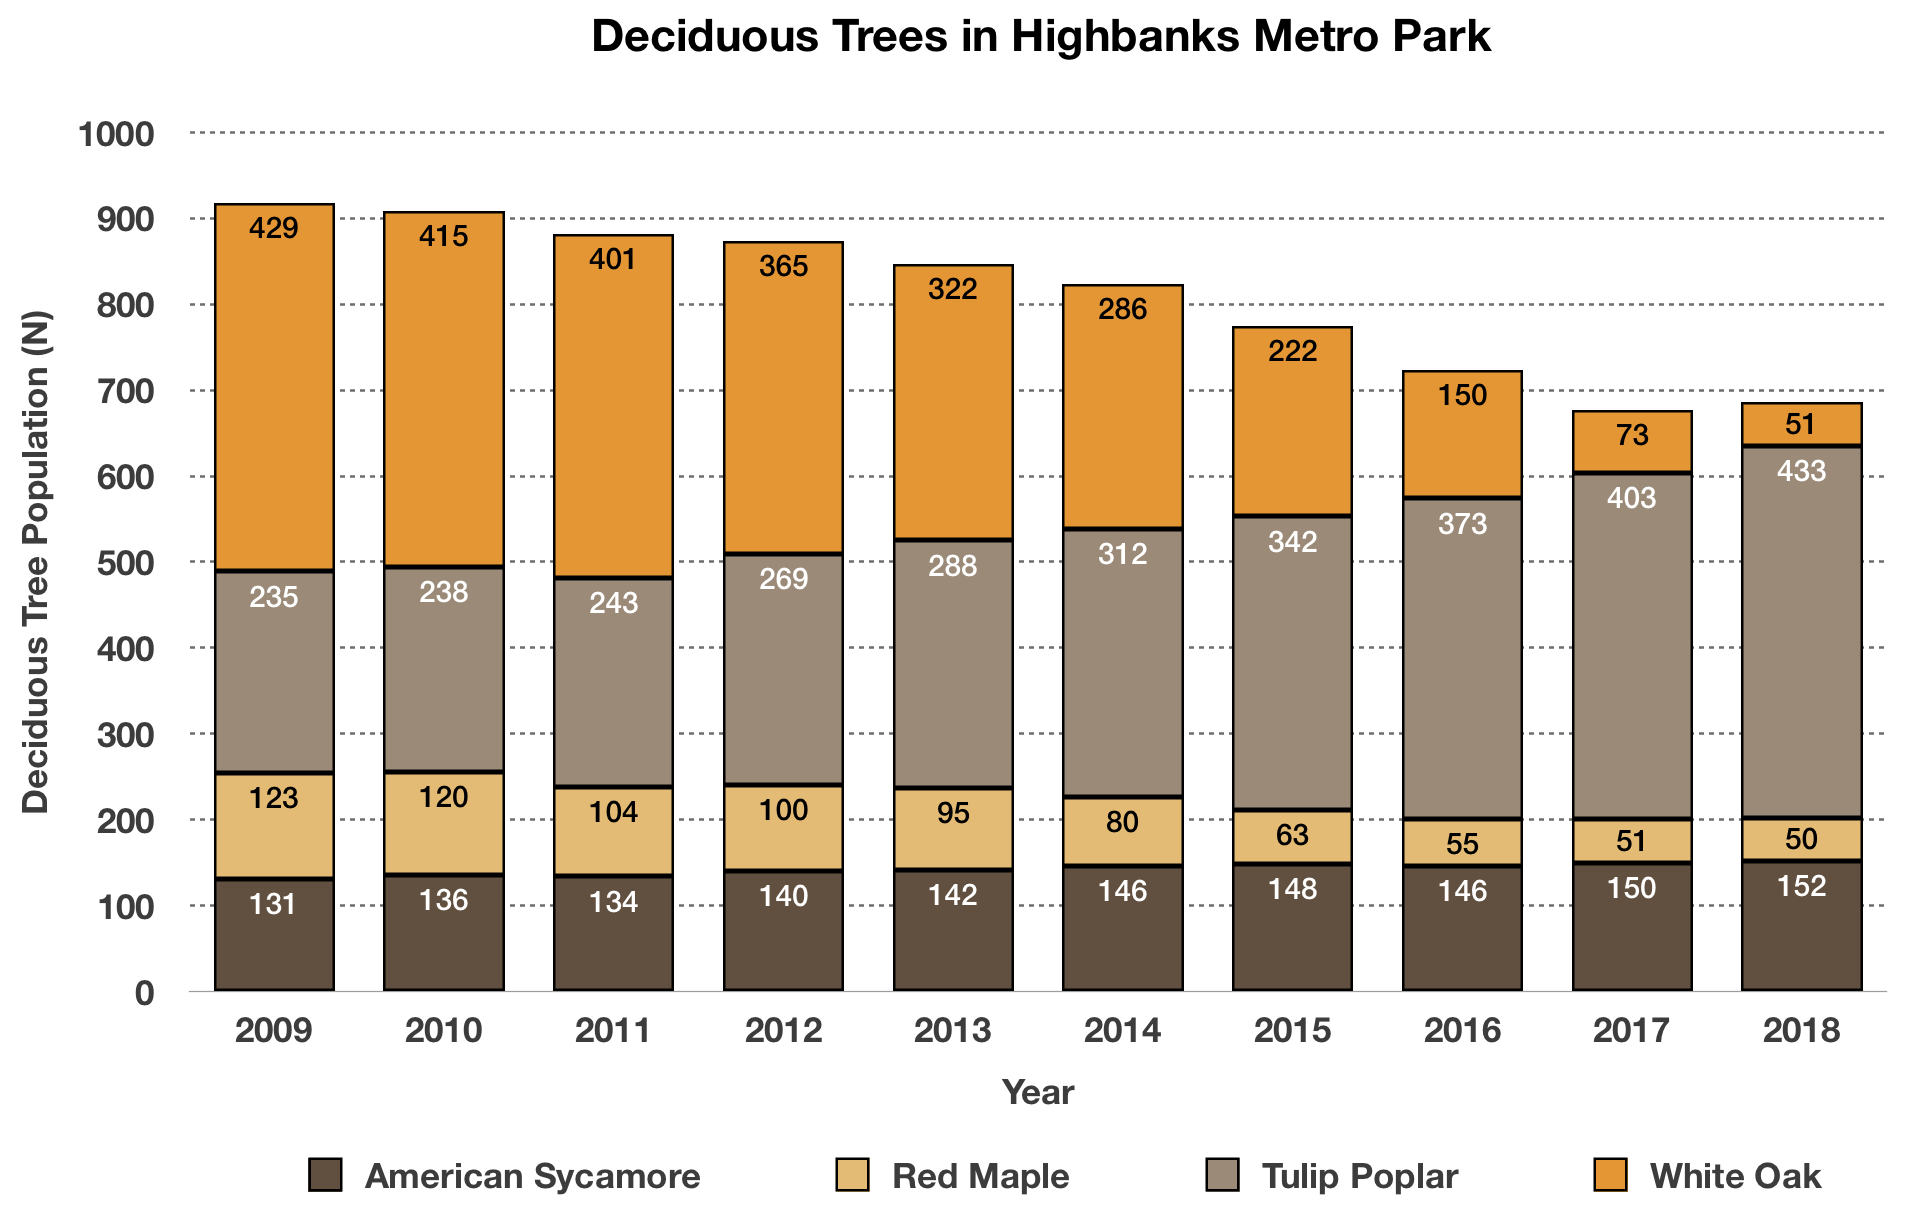
The Results and Discussion section should contain data, typically in the form of a graph, histogram, chart, image, color-coded map or table (Figs. 1 & 4). Very often data means numbers that scientists collect from making measurements. These data are typically presented to an audience in the form of graphs and charts to show a reader how these numbers change over time, space or experimental conditions (Fig. 7). Numbers can increase, decrease or stay the same and a graph, or another type of figure, can be effectively used to convey this information to a reader in a visual format (Fig. 7).
Figure 7. Example of a Graph
An audience will be attracted to a poster because of its figures and so it is very important for the author to pay particular attention to the creation, design and placement of the figures in a poster (Figs. 1 & 4). A good figure is one that is informative, easy to comprehend and allows the reader to understand the significance of the data and experiment. Very often an author will use color to draw attention to a figure.
The Discussion section should state the importance of the research that is presented in the poster. It should provide an interpretation of the results, especially in context to previously published research. It may propose future experiments that need to be conducted as a result of the research presented in the poster. It should clearly illustrate the significance of the research with regards to new knowledge, understanding and/or discoveries that were made as part of the research.
