Exercise H: Telling a Story with Numbers
Creating Charts and Interpreting Data
Background
Data captured in tables can be used to support a variety of claims and for a variety of purposes. For example, a table representing vehicle engine reliability, electronics reliability, and body integrity across models and years can be used by an individual to support a decision to purchase (or not purchase) a particular vehicle. That same table might be used by engineers to prioritize areas for development in subsequent designs of that vehicle model. Essentially, how you use the data depends on your background, context, and purpose (Are you an engineer or a car buyer? Are you making a purchasing decision or working on a professional project?).
To succeed in engineering work and communication, we should recognize that context matters when determining what a data set or data representation means. In the case below, knowing that cost of living is often significantly higher outside of Ohio might change one’s interpretation of the information. Context will matter for all interpretations of data, including consideration of who is interested in the interpretation, and how they will be using it.
Purpose
The purpose of this activity is to help you practice writing claims about data for a particular audience and purpose, as well as to demonstrate how adding additional contextual data can change a claim that was well-supported by the initial set of data.
Practice
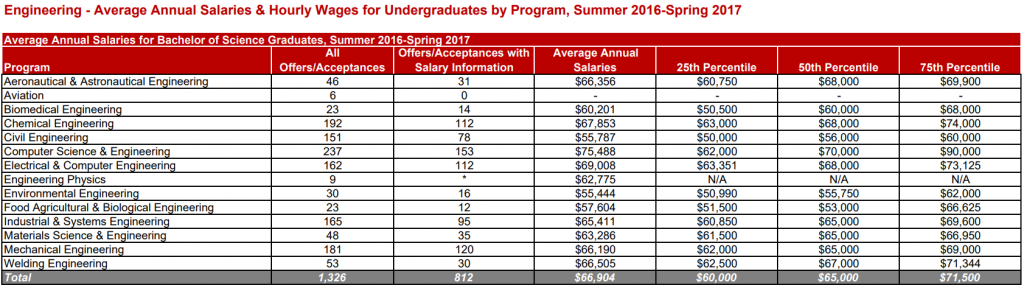
- Review the data in the Table 1, entitled, “Average Annual Salaries for Bachelor of Science Graduates, Summer 2016-Spring 2017”.
- Using this data, create a chart (with a title, labeled axes, and a legend) comparing the average salaries that you could use to guide high school students who want salary influence the type of engineering major that they will choose. Consider, which fields tend to make the most money?
- Write a paragraph addressed to a high school student who wants to select an engineering field based on the salary; using a comparison of the data, recommend which majors they should most closely consider.
Table 1: Average Annual Salaries & Hourly Wages for Undergraduate by Program, Summer 2016-Spring 2017
Discussion
-
- Which majors did you initially recommend that students investigating salary might pursue? What were the key data points that supported that recommendation?
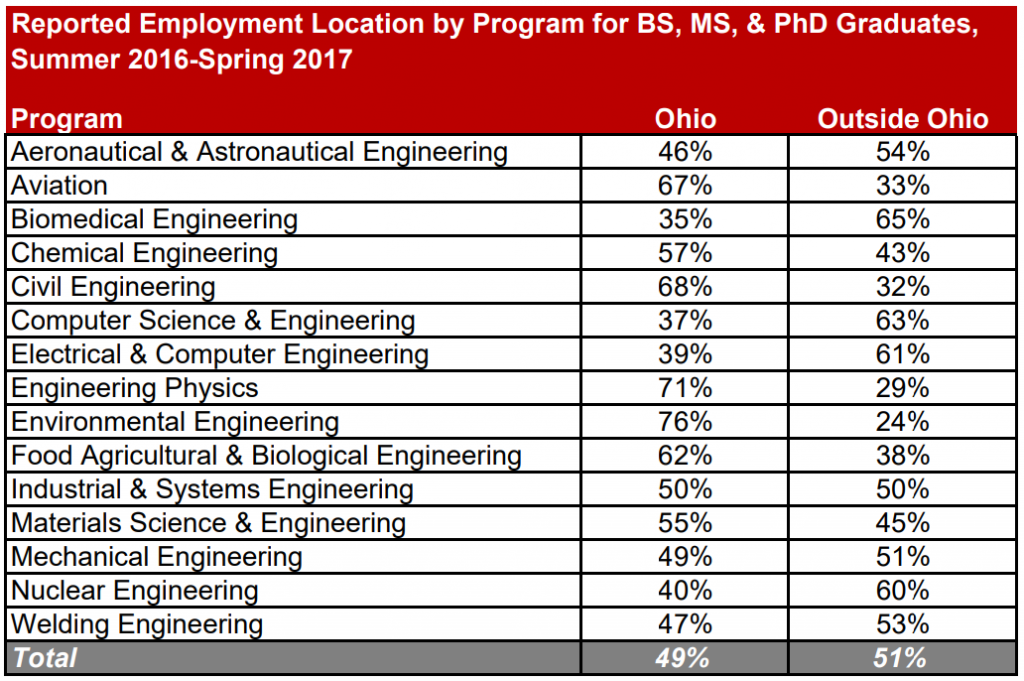
- Now, review the data in the Table 2, entitled, “Reported Employment Location by Program for BS, MS, & PhD Graduates, Summer 2016-Spring 2017” ; consider that the cost of living varies significantly between Ohio and other states. According to cityrating.com, the cost of living in Ohio is 8.16% lower than the national US average. Consider, also, that some engineering fields tend to be located in rural areas (ChemE) while others are concentrated in urban centers with higher cost of living (CSE, for example).
In what ways does this new contextual information influence your understanding of the data? In what ways could it lead you to alter your recommendation?
Table 2: Reported Employment Location by Program for BS, MS, & PhD Graduates, Summer 2016-Spring 2017
- Finally, is there any additional data that you could use to further nuance your understanding of this information and further modify your initial claim?
- e.g., civil engineers earn slightly more than environmental engineers, on average, upon graduation; does that difference persist after 5 years of industry experience? How do salary outcomes compare between environmental engineers and civil engineers with a master’s degree? How significantly does the ‘weight’ of the student’s interest in salary influence the interpretation of the data? Are there any non-fiscal benefits that could influence the high school student’s decision (e.g., interest in/passion for the subject; family pressure/identity associated with engineering discipline; benefits/vacation/flextime of various employers in each field; average number of hours worked/week by discipline, etc.)?
