Pollution
4.1 The Burning River- Aquatic Pollution in America’s Rust Belt
Benjamin W. Schumann
The former center of heavy industry in the United States, the Rust Belt, continues struggle with the effects of pollution. Negligent regulations on the waste produced by factories and non-point source pollution from agricultural field runoff have had dramatic effects on the surrounding environment. The fire on Cleveland’s Cuyahoga River was the culminating event that helped shape environmental protection in the United States.
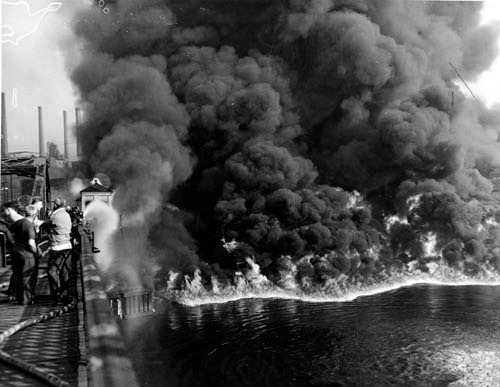
Photograph by James Thomas, 1952. Public Domain.
Cleveland, Ohio was once one of the premier manufacturing and industrial centers in United States. Cleveland, one of the largest U.S. cities, is located on the southern coast of Lake Erie and divided by the Cuyahoga River (Figure 2). The city has been affected by substantial amounts of airborne and aquatic pollution, mostly created by factory production during the 20th century.1 The externalities of factories in Cleveland are not the sole contributors to this pollution. Pesticides from agricultural runoff and waste from sewers were also major sources of pollutants.2 Lake Erie began to experience eutrophication, which increased algae content and decreased available oxygen for other aquatic life.2 The pollution of northeastern Ohio waterways culminated with the Cuyahoga River catching fire in 19692 (Figure 1). This event brought national attention to the lack of environmental responsibility in the industrial Midwest. As a result, groups such as the U.S. Environmental Protection Agency were formed to control the situation. This “burning river” phenomenon has helped inform both the public and researchers on the effects of runoff pollution and waste accumulation. However, pollution of aquatic ecosystems continues to be a major threat in the Rust Belt.
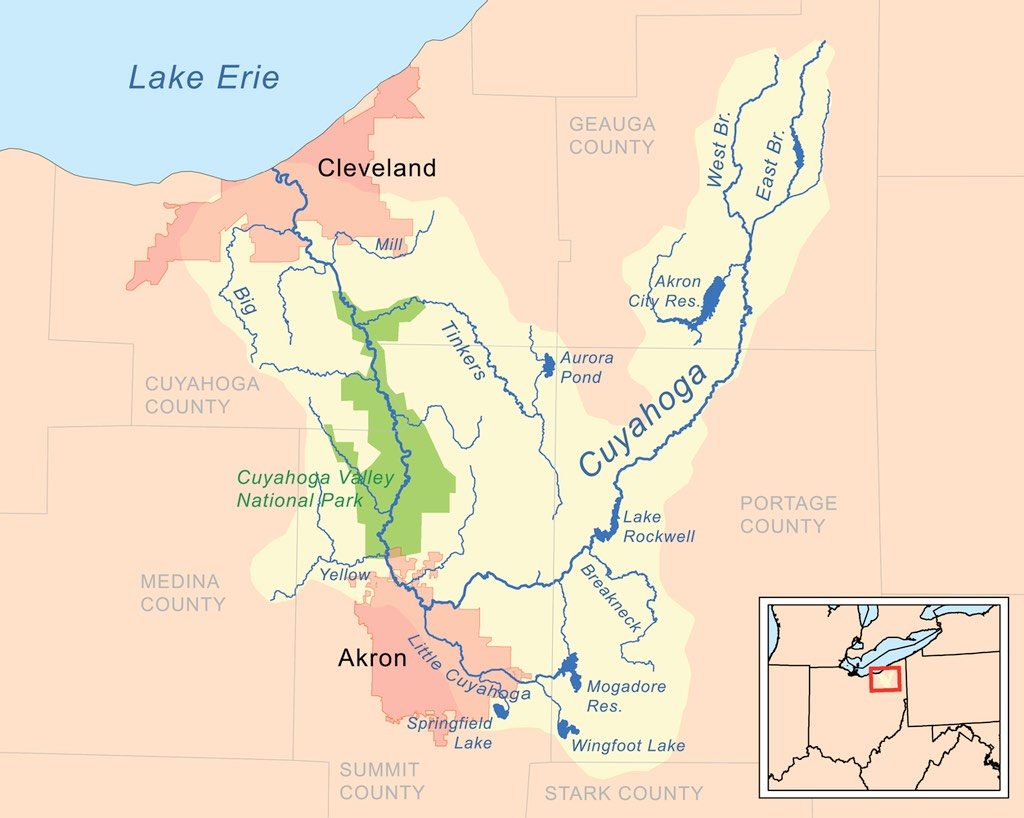
Courtesy of Kmusser, 2011. CC BY-SA 3.0.
It is clear that anthropogenic activity has changed the water quality of Lake Erie and the Cuyahoga River.1 Human activity has led to eutrophication in the Great Lakes since the mid-20th century. Pharmaceutical runoff in Lake Michigan from fellow industrial powerhouse cities such as Milwaukee, Wisconsin and Chicago, Illinois, continue to put water quality at risk throughout the American Midwest.3 Studies conclude that the water quality of the Great Lakes, represented by the fecal indicator bacteria (FIB) or coliform bacteria content, continues to be compromised near urban areas such as Cleveland.4 Similarly, alkylphenol levels, a marker for industrial pollution, remain elevated in the Cuyahoga River’s carp population.5 Water pollutants threaten biodiversity and the quality of drinking water available to nearly 30,000,000 Americans and a large portion of Canadians.6
The Great Lakes are still suffering from environmental irresponsibility. Fortunately, there is evidence that controls on phosphate use and disposal have helped Rust Belt waters to partially recover.1
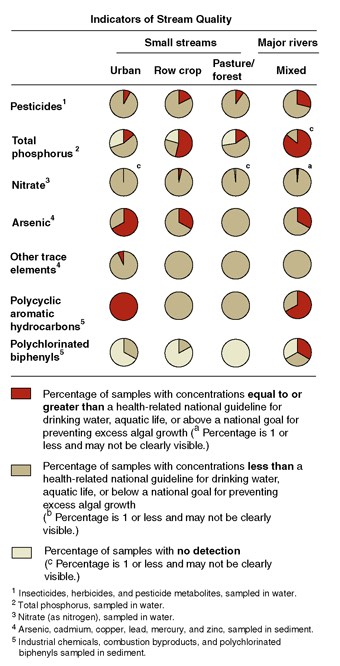
Courtesy D. N. Myers et al., 2000. Public Domain.
Public awareness over the misuse of America’s waterways has created outrage among many citizens. Consequently, policies have been adjusted to set controls on heavy manufacturing and refineries. For instance, the Clean Water Act of 1972 was passed to maintain and improve the condition of U.S. waterways.2,6 Unfortunately, there is an exception in this policy that allows companies to violate this provision if they can prove increased pollution creates a significant economic or social benefit.6 The Clean Water Act offers little protection against the contamination of aquifers, which is increasing relevant with the emergence of fracking, a technique for retrieving natural gases prevalent in some Rust Belt states.7 In 2007, one deposit of flame retardant-substances accounted for 37% of all wet deposition loadings in the 2000s, further demonstrating the inadequacies of the Clean Water Act.8
Courtesy of D. J. Welsch, 1991. Public Domain.
In spite of these lapses, the establishment of the Clean Water Act and the Environmental Protection Agency has helped correct many water quality impairments.1 However, many of these policies have become outdated and must be revamped to address the growing diversity of water quality problems.
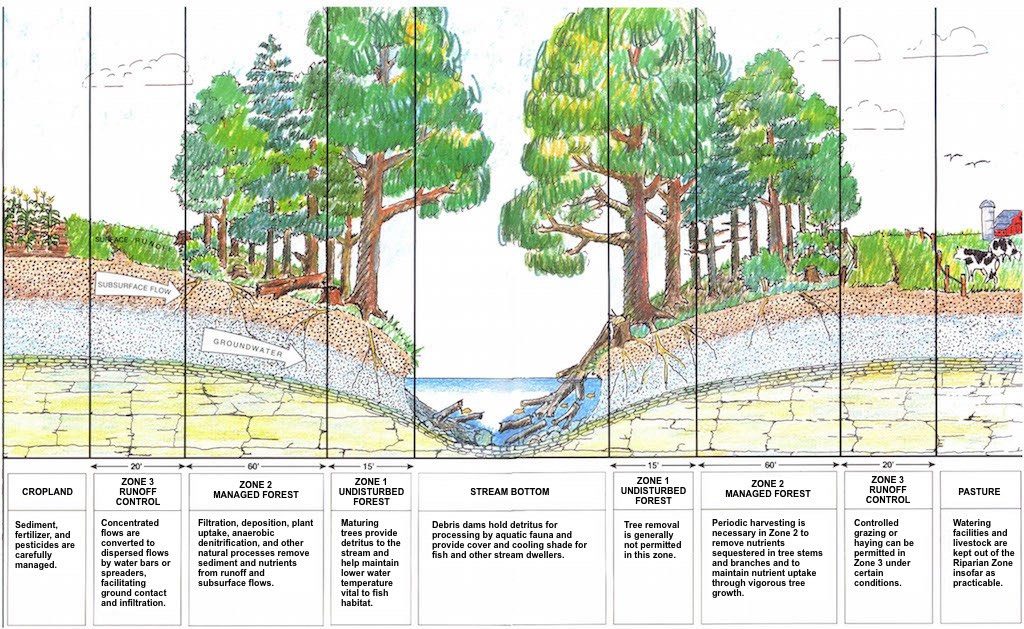
Agriculture is a major part of Ohio’s economy, however agricultural fertilizer use contributes to the majority of runoff pollution in the state. One possible solution to curb runoff pollution is the creation of riparian areas (Figure 4). Riparian areas consist of trees or other obstacles that serve as buffers between agricultural fields and water bodies. These buffers help prevent chemicals from entering the water system. One problem with riparian areas is that they occupy precious farmland, which makes any farm that installs these environmentally conscious runoff controls, a less competitive business. In addition, since agricultural field runoff is considered to be non-point source pollution, accountability remains an issue. Lake Erie is also warm and shallow, which creates perfect conditions for eutrophication (Figure 5). Phosphorus levels in the Great Lakes have decreased since the passage of the Clean Water Act, but large outbreaks of eutrophication continue to occur in the region.1,9 Water pollution continues to be a difficult to control problem in the Rust Belt. The United States has made great progress towards increasing environmental oversight in the Rust Belt, however policies must be strictly enforced and revised in order to reestablish a sustainable future for America’s waterways.
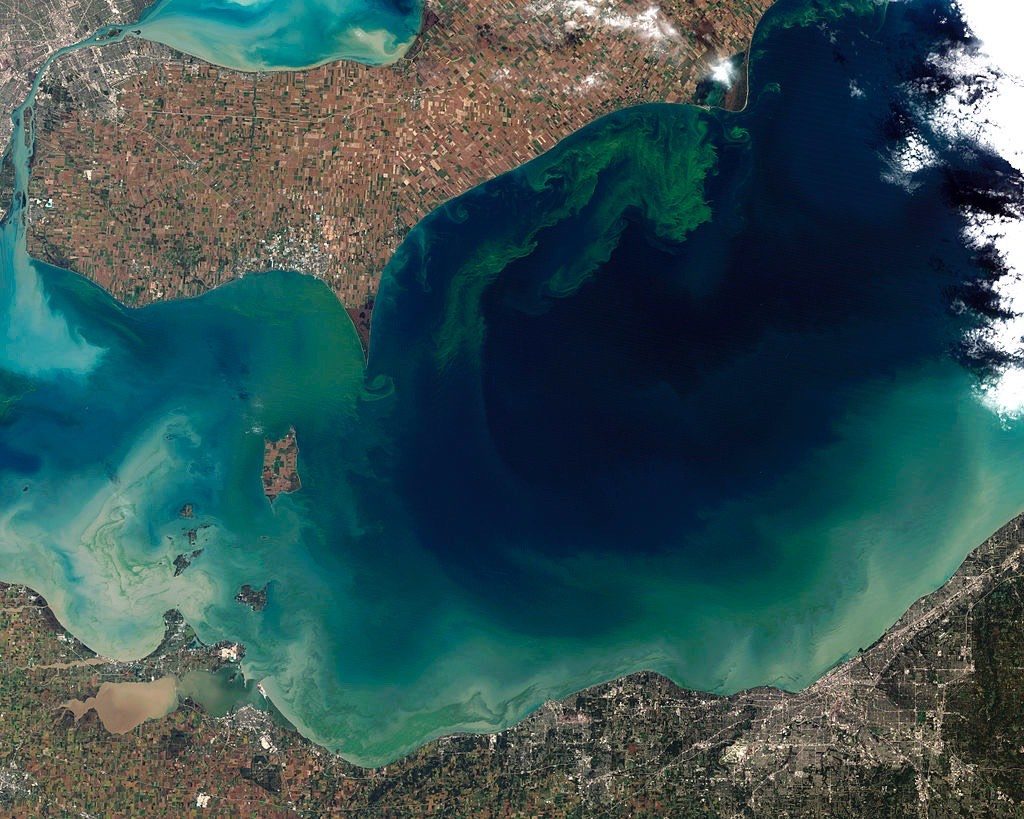
Photograph by Jesse Allen and Robert Simmon, 2011. Public Domain.
References
- Allinger, L.E., & Reavie, E.D., (2013). The ecological history of Lake Erie as recorded by the phytoplankton community. Journal of Great Lakes Research 39,3:365-383.
- Rotman, Michael. Lake Erie. Cleveland Historical. Accessed 14 Jan. 2014 from http://clevelandhistorical.org/items/show/58
- Blair, B.B., et al., (2013). Pharmaceuticals and personal care products found in the Great Lakes above concentrations of environmental concern. Chemosphere 93:2116- 2123.
- Haack, S.K., et al., (2013). Geographic Setting Influences Great Lakes Beach Microbiological Water Quality. Environmental Science & Technology 47:12054- 12063.
- Rice, C.P., et al., (2003). Alkylphenol and Alkylphenol-Ethoxylates in Carp, Water, and Sediment from the Cuyahoga River, Ohio. Environmental Science & Technology, 37:3747-3754.
- Environmental Protection: Muddy waters. (6 Sep 2007). The Economist. Retrieved from http://www.economist.com/node/9767825?zid=298&ah=0bc99f9da8f185b2964b6cef412227be
- J.P., (25 Jun 2013). Fracking: Fire water. The Economist. Retrieved from http://www.economist.com/blogs/babbage/2013/06/fracking
- Robson, M., et al., (2013). Wet deposition of brominated flame retardants to the Great Lakes basin – Status and trends. Environmental Pollution 182:299-306.
- Borre, Lisa. (24 Apr. 2013). Harmful Algae Blooms Play Lake Erie Again. National Geographic. Retrieved from http://voices.nationalgeographic.com/2013/04/24/harmful-algae-blooms-plague-lake-erie-again/
- Thomas, James. (1952). [Photograph of the Cuyahoga River on Fire on November 3, 1952]. Retrieved from The Cleveland Press Collection at Cleveland State University Library. Public Domain.
- Kmusser. (2011). [Map of the Cuyahoga River drainage basin]. Retrieved from Wikimedia Commons. CC BY-SA 3.0.
- Myers, D.N., et al., (2000). Water Quality in the Lake Erie-Lake Saint Clair Drainages Michigan, Ohio, Indiana, New York, and Pennsylvania, 1996–98. U.S. Geological Survey Circular 1203:35. Retrieved from http://pubs.water.usgs.gov/circ1203/. Public Domain.
- Welsch, DJ. (1991). Riparian Forest Buffer: Function and Design for Protection and Enhancement of Water Resources. USDA Forest Service. Retrieved from http://www.na.fs.fed.us/spfo/pubs/n_resource/buffer/part7.htm. Public Domain.
- Allen, Jesse & Simmon, Robert. (NASA Earth Observatory). (2011). [Photograph of a toxic algal bloom in Lake Erie]. Retrieved from Wikimedia Commons. Public Domain.
