Data Description- Types, Location, Spread
Partido, B.B.
What is a variable?
A variable is any entity that can take on different values. Anything that can vary is considered a variable. They can be quantitative (numerical) like age, height, or weight or qualitative (categorical) like gender, race, or country. Any specific value of a variable is called an attribute, such as age- 31, 40, 21 or attitude- agree, neutral, disagree, or 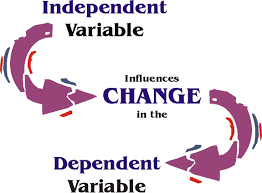 gender- male, female, non-conforming.
The dependent variable is the variable a researcher is interested in. An independent variable is a variable believed to affect the dependent variable. In an experiment, the researcher controls or manipulates the independent variable and measures the outcome or dependent variable.
Types- Levels of measurement
The level of measurement refers to the relationship among the values that are assigned to the attributes for a variable. This is important to know because: 1. knowing the level of measurement helps you decide how to interpret the data from that variable and 2. knowing the level of measurement helps you decide what statistical analysis is appropriate on the values that were assigned.
Nominal measurement- numerical values just “name” the attribute uniquely. No ordering of the cases is implied. 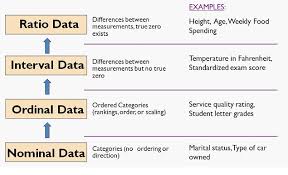
Ordinal measurement- attributes can be rank-ordered. Here, distances between attributes do not have any meaning.
Interval measurement- the distance between attributes does have meaning.
Ratio measurement- the distance between the attributes does have meaning and there is always an absolute zero that is meaningful.
Location and Spread
Location or central tendency is the distribution is an estimate of the “center” of a distribution of values.
The mean or average is probably the most commonly used method of describing central tendency. To compute the mean all you do is add up all the values and divide by the number of values. The median is the score found at the exact middle of the set of values. One way to compute the median is to list all scores in numerical order, and then locate the score in the center of the sample. The mode is the most frequently occurring value in the set of scores. To determine the mode, you might again order the scores as shown above, and then count each one.
Spread refers to the dispersion of the values around the central tendency. The range is simply the highest value minus the lowest value. The standard deviation shows the relation that set of scores has to the mean of the sample. The formula for standard deviation is the square root of the sum of the squared deviations from the mean divided by the number of scores minus one. This formula does not need to be memorized.