Inference, Hypothesis Testing, p-values
Partido, B.B.
With inferential statistics, conclusions are trying to be reached that extend beyond the immediate data alone. For 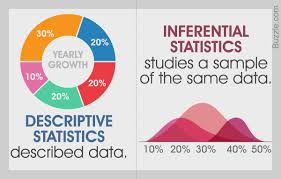 example, inferential statistics try to infer from the sample data what the population might think or to make judgments of the probability that an observed difference between groups is a dependable one or one that might have happened by chance in this study. Descriptive statistics simply to describe what’s going on in our data and inferential statistics make inferences from our data to more general conditions.
A hypothesis is a specific statement of prediction. It describes in concrete (rather than theoretical) terms what you expect will happen in your study. Not all studies have hypotheses.
- Descriptive research design– Describing the phenomenon of interest (No hypothesis)
- Correlational research design– Testing for any relationships between the variables (Hypotheses exist)
- Experimental research design– Testing for cause and effect relationship between the variables (Hypotheses exist)
 Two hypotheses exist to predict that there will be a relationship between two variables in your study. The way we would formally set up the hypothesis test is to formulate two hypothesis statements:
- Null hypothesis: one that describes all the other possible outcomes. No relationships exist between the variables.
- Alternative hypothesis: one that describes your prediction. Relationships exist between the variables.
Your prediction is that variable A and variable B will be related (alternative hypothesis) and the only other possible outcome would be that variable A and variable B are not related (null hypothesis).
Hypothesis Testing and p-values
The alpha level refers to the amount of error (due to chance) that researchers are willing to accept regarding the statistical results. The general acceptable alpha level is .05. This means that researchers are 95% confident (1-alpha level) that the results are due to the experiment and not due to chance. This is usually represented with the p-values:
- p-values <.05= statistical significance
- p-values >.05= No statistical significance
The p-values are then used to either accept or reject the null and/or alternative hypothesis.
- p-values <.05= statistical significance; Reject the null hypothesis (no significance) and accept alternative hypothesis (significance)
- p-values >.05= No statistical significance; Accept the null hypothesis (no significance) and reject the alternative hypothesis (significance)