Confidence Intervals
Partido, B.B.
A confidence interval (CI) is an estimate, computed from the statistics of the observed data, that might contain the  true value of an unknown parameter. The interval has an associated confidence level that quantifies the level of confidence that the parameter lies in the interval and the amount of error (α or alpha level). For example, the researchers have 95% confidence and α-level of .05 that the mean score is between 90-95%.
More strictly speaking, the confidence level represents the frequency (i.e. the proportion) of possible confidence intervals that contain the true value of the unknown population parameter. In other words, if confidence intervals are constructed using a given confidence level from an infinite number of independent sample statistics, the proportion of those intervals that contain the true value of the parameter will be equal to the confidence level. For example, using the example above, if the researchers performed the same experiment 100 times, the mean score would be between 90-95% in 95 of the 100 times.
Changes in Confidence Interval
Shorter intervals indicate more certainty or ‘confidence’ in our estimate of the mean OR a greater willingness to make a mistake. The most common ways to shorten confidence intervals are the following:
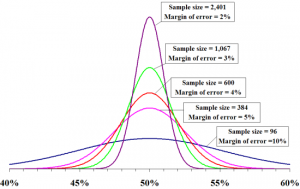 larger sample sizes
- decreasing the variability (smaller standard deviation
- decreasing the level of confidence (e.g., going from 99% to 95% or α=.01 to .05)
Here’s some additional information about confidence intervals.