Ch. 2: Alcohol Epidemiology & Treatment Needs
In the United States, a majority of individuals either do not drink alcohol (35%) or do so at low-risk levels (37%), however about 28% drink at levels placing them at risk for AUD or other serious health consequences (NIAAA, 2016).

Before proceeding to read the next section, stop and think about what you expect the epidemiology to say about who engages in alcohol use, binge drinking, and heavy drinking—what age, gender, race/ethnic group data will show and how this might vary by different geographical regions of the United States. When you are done with this section, you will revisit your guesses, so jot them down to refer back to them later.
Here are recent facts and figures for your consideration, derived from the 2018 NSDUH survey data concerning individuals aged 12 and older in the U.S. (SAMHSA, 2019).
Past month alcohol use:
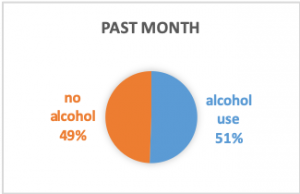 51.1% reported having used alcohol in the past month (considered “current use”).
- Past month use rates varied a bit by geographical region: 47.1% in the South, 51.6% in the West, 54.6% in the Midwest, and 54.8% in the Northeast (a more than a 10% difference between the lowest and highest reporting regions).
- The rate was lowest in completely rural areas (43.3%) and highest in large metropolitan areas (52.9%).
- The rate was highest among persons living at 2 times or more of the poverty level (58.4%) and lowest among persons living below the poverty level (34.7%).
Past month binge alcohol use:
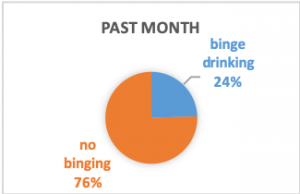 24.5% reported having engaged in binge drinking in the past month.
- Binge drinking rates varied a bit by geographical region: 23.0% in the South, 23.7% in the West, 27.1% in the Midwest, and 25.8% in the Northeast.
- The rate was lowest in completely rural areas (22.0%) and greatest in large metropolitan areas (25.0%).
- The rate was highest among persons living at 2 times or more of the poverty level (25.8%) and lowest among person living below the poverty level (22.3%).
Past month heavy alcohol use:
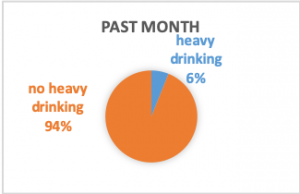 6.1% reported heavy alcohol use in the past month.
- Heavy alcohol use varied a bit by geographical region: 5.5% in the South, 6.0% in the West, 6.4% in the Northeast, and 6.8% in the Midwest.
- Heavy alcohol use was higher in completely rural areas (6.6%) than large metropolitan areas (6.0%); it was greatest in less urbanized areas (6.9%) and lowest in small metropolitan areas (5.8%).
- The rate of heavy alcohol use was highest among persons living at 2 times or more of the poverty level (6.6%), lowest among persons living at or up to 2 times the poverty level (5.0%), and between these rates among persons living below the poverty level (5.3%).
In short, it seems a majority of individuals who currently drink alcohol do so within reason—less than binge or heavy drinking patterns. There existed notable variability in alcohol use behavior based on gender, age, and race/ethnicity reported among persons of legal drinking age (21 years) in the NSDUH 2018 data, as well (SAMHSA, 2019).
|
Demographic Group |
Past Month Alcohol Use |
Past Month Binge Drinking |
Past Month Heavy Drinking |
|
Gender: male female |
60.8% 52.4% |
31.5% 22.1% |
9.2% 4.4% |
|
Race/Ethnicity: White Black or African American Asian Hispanic or Latino American Indian or Alaskan Native Native Hawaiian or Other Pacific Islander 2 or more races |
61.1% 49.0% 43.9% 48.2% 39.7% 38.5% 53.7% |
27.2% 26.3% 16.0% 28.4% 24.8% 26.8% 26.8% |
7.7% 5.0% 2.9% 5.0% 7.1% 5.9% 6.6% |
|
Age: 12-17 18-25 26 and older |
9.0% 55.1% 55.3% |
4.7% 34.9% 25.1% |
0.5% 9.0% 6.2% |
As you can see, men were more likely than women to engage in all three drinking patterns, and the difference was most dramatic in the heavy drinking category (more than twice the rate). The difference between emerging adults (18-25) and adults (26 and older) was apparent in both binge and heavy drinking categories; the rate of binge drinking among adolescents (12-17) was just over half the rate for alcohol use in this age group. The racial/ethnic group with the highest rate of alcohol use or heavy drinking, and second highest rate of binge drinking, were individuals identifying as white. While alcohol use among black or African American survey respondents was third greatest (behind those identifying with two or more races or as white) and binge drinking tied as second highest, heavy drinking was tied for second lowest (above only Asian respondents). And, while alcohol use was second lowest among American Indian or Alaskan Native respondents, this group was second highest for heavy drinking. All together these statistics contradict some common stereotypes about drinking behavior and shed light on who among the U.S. population is most likely to engage in risky drinking patterns (binge or heavy drinking).
After reading about the epidemiological data, stop and think about what you expected the epidemiology to say and what you just learned about who engages in alcohol use, binge drinking, and heavy drinking—what age, gender, race/ethnic group data showed and how this varied by different geographical regions of the United States.
- Where differences occurred, why do you think your guesses were different from the evidence?
- How do you think the data relate to stereotypes and stigma in our society and policies?
Treatment Needs
Among all 2018 NSDUH survey respondents, 3.9% perceived a need for specialized alcohol treatment during the past year; 1.6% made an effort to receive treatment (SAMHSA, 2019). The observed discrepancy between needing and seeking treatment persisted across age groups, with the perceived need more than doubling in each older age group.
|
Age group |
Perceived need |
Effort to receive |
No effort to receive |
|
12-17 |
1% |
0.7% |
0.3% |
|
18-25 |
2.1% |
0.7% |
1.4% |
|
26 and older |
4.6% |
1.9% |
2.7% |
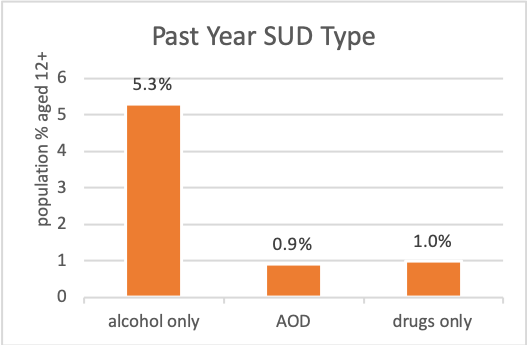
You may recall from Module 1 in our course that individuals who have a diagnosable substance use disorder most commonly have a problem with alcohol. From the 2017 NSDUH survey (SAMHSA, 2018), over 19.7 million individuals aged 12 or older (7.2% of population) were estimated to experience a substance use disorder (SUD) involving alcohol and/or and illicit drug use during the past year; the vast majority involved alcohol alone (5.3%) or in combination (0.9%) with illicit drugs (alcohol and other drugs, AOD), leaving 1% with an illicit drugs-only form of SUD.
When individuals seek treatment for alcohol problems. A study involving 47 individuals followed two years after participating in a treatment study for alcohol use disorder (COMBINE Project) reported the ages at which they first experienced diagnostic criteria of alcohol use disorder versus when they first identified their drinking pattern as problematic and first attempted to cut down or abstain from drinking (Begun, Berger, Salm Ward, 2011). The difference in mean “first” age was more than 10 years (see Table adapted from Begun, Berger, Salm Ward, 2011, p. 113), a finding consistent with other literature concerning the discrepancy in ages between when AUD becomes a problem and individuals first seek treatment.
|
Drinking “First” |
Age Range |
Mean Age |
|
drinking for longer periods than intended |
14-40 |
21.77 |
|
drinking greater amounts than intended |
14-45 |
24.54 |
|
family or friend complaints or concerns about the drinking |
16-55 |
27.45 |
|
need to consume greater amounts (developing tolerance) |
15-55 |
29.59 |
|
physical withdrawal symptoms when not drinking |
13-53 |
32.40 |
|
identified drinking pattern as problematic |
15-55 |
32.32 |
|
attempted to cut down or abstain from drinking |
16-61 |
34.83 |
These participants reported having made 1-11 significant attempts to change their drinking behavior over their life course, with the mean number of attempts being 3.4 (median of 3 attempts). Approximately equal numbers of first change attempts were either self-change (32%) or formal treatment attempts (34%); “By the second attempt, the proportion had tipped heavily in favor of formal strategies (51%), and self-change was much less frequent than before (22%)” (Begun, Berger, Salm Ward, 2011, p. 114). Individuals employ a variety of strategies when attempting to change their alcohol use/misuse behavior.
Is formal treatment necessary? This question is heavily debated in the literature and in practice: “Researchers and practitioners are only beginning to understand the nature and significance of change attempts that occur outside of formal treatment” (Begun, Berger, & Salm Ward, 2011, p. 105). A convincing body of evidence indicates that many individuals are able to successfully change their problematic drinking behavior without engaging in formal, specialized alcohol treatment—self-change attempts alone may suffice (Sobell, Cunningham, & Sobell, 1996; Sobell, Cunningham, Sobell, & Tonneato, 1993) or in conjunction with other informal and formal treatment interventions (DiClemente, 2006). Another convincing body of evidence concerns the effectiveness for many individuals of brief intervention delivered outside of specialized alcohol treatment programs (Zweben & West, 2020). These alternatives may suffice for individuals engaged in alcohol misuse without meeting diagnostic criteria for AUD or, perhaps, on the mild end of the continuum for an AUD.
For individuals meeting diagnostic criteria for AUD, particularly in the more severe range, formal AUD treatment may be needed. Options vary and include behavioral counseling (e.g., cognitive behavioral/coping skills training interventions, contingency management, community reinforcement and family training, behavioral couples or family involved therapies), medication-assisted treatment, and combinations of these options (Zweben & West, 2020). The American Society of Addiction Medicine (ASAM) has established a set of guiding decision rules to help determine the appropriate level of care related to assessment of individuals in need of alcohol (or other substance) treatment intervention. The ASAM levels of care guidelines reflect a continuum of care options indicating increasing intensity in the levels of care on a 5-point scale (0-4):
- No intervention (0)
- Early intervention (0.5)
- Outpatient services (1)
- Intensive outpatient services (2.1)
- Partial hospitalization services (2.5)
- Clinically managed low-intensity residential services (3.1)
- Clinically managed population-specific high-intensity residential services (3.3)
- Clinically managed population-specific high-intensity residential services (3.5)
- Medically monitored intensive inpatient services (3.7)
- Medically managed intensive inpatient services (4)
Detoxification (detox) is an example of a process that could take place at several of these levels, depending on the assessed need (i.e., 2.1 to 4). The goals of detox services are:
(1) safely manage the initial, acute withdrawal period (hours to days after ceasing alcohol use) and ensure the person is medically stabilized;
(2) engage the individual in longer-term treatment plan.
Recovery from alcohol use disorders, with or without formal treatment, may best be supported with appropriate case management or wrap-around supportive services (Zweben & West, 2020), as well as peer support and/or mutual help program participation (Bersamira, 2020; Zweben & West, 2020).
