Module 3 Chapter 3: Measurement
This chapter examines quantitative measurement principles as applied in intervention and evaluation research, keeping in mind that qualitative methods have the potential to:
- Inform subsequent quantitative study research questions,
- Inform the development of measurement tools, procedures, and participant recruitment/retention is subsequent quantitative studies,
- Assess intervention implementation and fidelity during a quantitative study, and
- Develop a context for interpreting the results of a quantitative study.
Thus, quantitative studies for understanding social work interventions can be enhanced when qualitative study approaches are also applied, before, during, and after.
In this chapter, you learn:
- how quantitative measurement content from our prior course (variable types, validity, reliability, and locating measurement instruments) relates to research for understanding social work interventions;
- issues related to measuring change in intervention and evaluation research;
- principles and issues in addressing cultural relevance in designing intervention and evaluation research.
Measures & Variables
You may recall from our earlier course that the tools used in data collection are used to measure variables important and relevant for the study aims, questions, and design. Searching the literature on a topic might result in many different measures being identified for gathering data about a study variable—investigators are then challenged with the need to evaluate the different options and select the one best suited to their purposes. Here are several important points considered in this decision-making process:
- how adequately the tool measures the target variable (a validity issue)
- how accurately/consistently the tool measures the target variable (a reliability issue)
- how appropriate the tool is for the population engaged in the study (age, ability, and cultural relevance, for example)
- participant burden involves with its use
- cost and whether it is available in the public domain (or permission must be purchased from the developer/copyright holder)
- whether modifications necessary to make it fit the study and what the risks to validity and reliability might be when modified (the psychometric evidence no longer applies to a modified measure)
- whether an appropriate tool exists, or one needs to be created (with unknown validity, reliability, and other psychometric properties).
Let’s consider at an example from a prisoner reentry study (Begun, Early, & Hodge, 2016). The research question was expressed as, “What disparities exist between the mental health and addiction treatment services that adults need during community reentry after incarceration and services they actually receive?” First, the investigators faced challenging decisions about measuring “need” for these different service types. Three possible options considered included:
- Individual study participants self-identified their need status;
- Standardized screening tests indicated a person’s needs; and,
- Individuals’ past history of service use implied an ongoing, present need.
Each option had associated advantages and disadvantages. For example, while self-identification is responsive to the social work value placed on self-determination, it is also confounded by individual differences in perception. Thus, the data lack consistency in measurement values. This problem of measurement inconsistency means that this option for measuring the variable is not a strong measurement choice. Two different individuals facing identical circumstances might interpret their needs quite differently: one might identify a high need for service while the other similarly-situated person identifies the need as low. The result is less a measure of the need for services than it is a measure of perceptions of need. Measurement inconsistency is a relatively common problem arising in rating scales, for instance when someone is asked to rate frequency in terms of “seldom, sometimes, often.” One person’s interpretation of “seldom” might be very different from another person’s. Measurement inconsistency is a less relevant problem when the aim of the study involves learning about individuals’ personal perceptions (internal subjective states, beliefs, opinions, mood) rather than learning about external, objective realities and events.

The use of standardized screening tools has the advantage of imposing a greater degree of measurement consistency, reducing “perceptions” as a source of individual differences and measurement error. However, standardized measurement tools may not exist for measuring study variables of interest, particularly in new, emerging areas of research. In addition, standardized measurement tools may not be appropriate for the population providing the data—they may not be appropriate for the participants’ age, ability/disability, life circumstances, or culture. For example, the standardized alcohol screening tool called the AUDIT (Alcohol Use Disorders Identification Test) has strong psychometric properties and relevance for a broad range of adults in the general population, is relatively brief (10 items taking about 2 minutes), and available in the public domain. However, the most predictive questions are the first three that ask about quantity and frequency of drinking—at least in terms of screening with young and middle-aged adults (Lee, Jung, & Choi, 2018). Many of these questions, however, are of limited value in screening persons living in restricted environments, such as jails, prisons, or residential treatment programs. The questions presume that individuals currently have access to alcohol:
- How often do you have a drink containing alcohol?
- How many drinks containing alcohol do you have on a typical day when you are drinking?
- How often do you have six or more drinks on one occasion?
To effectively screen for probable risk during community reentry after release from the institutional setting the questions might need to be modified to refer to a period of time prior to institutionalization. Otherwise, the risk of failing to identify persons with probably alcohol use disorders is high since they may be answering “never” to these items while living in a controlled environment. This modification, however, is made at the risk of unknown reliability and validity for the measure’s modified version.
The third option, using an individual’s past history as an indicator of present or future needs, relies on several assumptions, any of which may be flawed. For example, past access to services may have been influenced by racial, ethnic, gender, gender-identity, socio-economic, or diagnosis inequities in the system rather than differences in actual need. Or, for example, an individual might not have the same needs moving forward if the problem has been effectively addressed with past services. On the other hand, the need may have emerged recently and not be detected through a measure of past need.

As you can see, identifying the best way to measure variables in social work research is not always simple and straight forward. The investigators in our example (Begun, Early, & Hodge, 2016) elected to use a multi-pronged approach where all three measurement strategies were combined. This, however, was also associated with a significant degree of participant burden, generating many interview questions. The varied tools used included standardized measures, modified measures, and some items developed specifically for the study at hand. In this way, they were able to include a wide range of variables and variable types. This leads to a review of variable types and extension of what we learned in the previous course to research for understanding social work interventions. This will be is helpful both in terms of thinking about the choices made in published investigations and choices you might need to make in your own work.
Variable Types & Levels Revisited and Extended
In our earlier course you learned about different types of variables; these continue to be relevant for research concerning social work interventions. Let’s see how this information (still) applies.
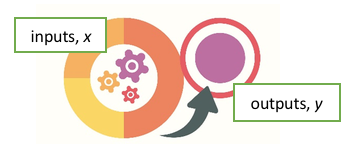
Dependent and independent variables.
As you may recall from our earlier course, independent variables are manipulated in the study design, and dependent variables are where the impact of changing the independent variable is observed. The independent variable in intervention studies usually relate to the intervention itself, for example:
- which intervention is being delivered (e.g., innovative intervention vs control or treatment as usual/TAU condition; two or more different interventions compared),
- intervention “dose” or intensity (e.g., high, medium, or low intensity/frequency),
- who delivers the intervention (e.g., MSW, BSW, or paraprofessional practitioner),
- when the intervention is delivered (e.g., at first symptoms vs when symptoms exceed a clinical threshold/diagnosis criterion point).
Dependent variables in intervention and evaluation research are usually the outcomes investigators examine in terms of an intervention effects or impact. For example, this might include variables we hope to change, such as:
- number of symptoms,
- frequency of symptoms,
- severity/intensity of symptoms,
- co-occurring problems,
- cost of delivering services,
- access or barriers to service,
- attitudes, opinions, knowledge, skills or behaviors.
Note that the definition of independent variables can be a bit confusing when the “intervention” is a natural event that no investigator intentionally manipulated—an event such as a natural disaster (hurricane, tornado, tsunami, or earthquake); a traumatic critical incident (terrorist threat, violence incident, or other human-directed event), or political protest/disruptive innovation (e.g., Black Lives Matter, #LouderTogether, #MeToo, or #NeverAgain movement). Social workers might be interested to see how a specific outcome changed in relation to a naturally occurring “intervention.”
Nominal/categorical variables.
Sometimes dependent or independent variables represent a specific set of categories. For example, in our design discussion we saw examples where the independent variable (X) had two categories:
- intervention (X) and non-intervention control,
- innovative intervention (X) and treatment as usual (XTAU), or
- two different interventions (X1 and X2).
For example, the dependent variable (y) might be treatment completion versus non-completion—two categories. Or, it might be symptom change measured in three categories: symptom improvement, symptom degradation (decline), or no change in symptoms. The dependent (outcome) variable could reflect individuals meeting specific demographic characteristics—for example, national origin among new Americans, gender identity, single- or two-parent headed households, children living in their family homes or out-of-home/foster care, employment status, diagnostic category, access to healthful and affordable food, water security, exposure to violence, and others. These variables are nominal because there is no intrinsic numeric order to the categories. These variables might be independent variables in some studies (e.g., how individuals are sorted into categories); they are dependent variables if they represent the outcome that an intervention is attempting to modify.

Ordinal variables.
The categories of some variables do have an intrinsic numeric order or sequence. An intervention research example involves the manipulation of intervention dose delivered to different groups (dose being the independent variable, x): perhaps low dose (1 visit), medium dose (2-4 visits), high dose (5 or more visits). Studies demonstrating equal effectiveness of planned brief therapies compared to lengthier or unlimited therapy included comparisons of dose in this manner (Smyrinos & Kirkby, 1993, for example). The outcome (dependent) variable might be ordinal, as well. For example, the outcome might be no symptoms present, non-clinically significant symptoms present, clinically relevant symptoms present; or, the outcome might be level of client satisfaction indicated on a 5-point scale (not at all to extremely much).
![]()
Interval/scale/continuous variables.
Sometime variables have numerical values that vary in equal-sized increments or intervals. For example, outcomes are often measured on assessment scales such as the Alcohol Use Disorder Identification Test (AUDIT) where possible scores range from 0 to 40 and higher scores mean greater probability of an alcohol use disorder.
The AUDIT example is rich in that investigators (or clinicians) also are able to convert the interval scale score into a dichotomous categorical score that could be considered ordinal. AUDIT scores of 8 or greater designate a “positive” screening result for men, and lower scores are “negative” screening results for men; AUDIT scores of 7 designate a “positive” screening result for women, and lower scores are “negative screening results for women (Bradley, Boyd-Wickizer, Powell, & Burman, 1998; Saunders, Aasland, de la Fuenta, & Grant, 1993). The AUDIT scale scores also may be used to create three categories: “negative” screening, “positive” screening for hazardous drinking, and “probable alcohol dependence” (scores of 13 or greater for women, or 15 or greater for men).

While it is possible to convert a scale or continuous variable into a categorical variable, it is not possible to convert nominal or categorical data into scale or continuous variables. Consider a variable like age in years. If investigators collect data as the number of years in a person’s age (or compute it as the current year minus the year of birth), they have a continuous scale variable for age. This can be converted into categories such as infant/toddler (0-2 years), preschool (3-4 years), early school age (4-10 years), preadolescent (11-12 years), adolescent (13-17 years), emerging adult (18-25 years), and so forth through adulthood and late life. However, if the investigators collected the data as ordinal categories, they cannot convert this reliably into a continuous variable since if a person is in the emerging adult category, there is no way of knowing if this means 18, 19, 20, 21, 22, 23, 24, or 25 years. We see the same issue with variables like income, duration of time (e.g., since symptoms appeared or disappeared), and scores on many measurement scales (e.g., depression, anxiety, pain, reoffending risk, conflict in interpersonal relationships, and many others). This is an important decision to make about study variables prior to collecting data
In order to refresh your skills in working with Excel and gain practice with the entering data for these different types of variables, we have an exercise in the Excel workbook to visit.
Interactive Excel Workbook Activities
Complete the following Workbook Activity:
Unit of Analysis Issues Revisited and Extended
The concept of unit of analysis was previously introduced in our first course—this it both a measurement and an analysis issue. When a study concerns the benefits of an individual-level intervention, it is relatively easy to identify the unit of analysis: data are collected about the participating individuals and analyzed at the individual level. The picture becomes a little more complicated when studying more complex systems. For example, imagine a social work BSW program wanting to investigate the impact of adding content designed to improve graduates’ performance on the state licensure exam. The program might compare graduates’ passing rates during the “pre” and “post” intervention (curriculum change) years. Data would be collected about each individual student’s exam outcome, but each student appears only once in the study: when they took the licensure exam. On the surface, this looks like a cross-sectional study. However, the unit of analysis is not change for individual students—none of the students experienced both curriculum conditions. The unit of analysis is change for whole cohorts of students, not change at the level of individual students. In other words, while students are the source of the pre-/post- data, they are not the unit of analysis. The unit of analysis is the program in this longitudinal comparison study (before and after the curriculum change).
Another social work example of the unit of analysis issue appears with policy evaluation. The data points might represent individuals, families, neighborhoods, or other local entities. But, the change related to the policy intervention is evaluated at the level of a county, region, state, or nation. That higher level is the unit of analysis, not the individuals who provided data which investigators aggregated at the more macro level. Imagine evaluating a new policy to reduce a community’s rate at which individuals with serious mental disorders become incarcerated—the intervention involves a police/court/mental health partnership diverting these individuals to outpatient services for managing their mental disorders. Even though each person arrested provides the data used to measure the overall rate of incarceration (before and after the policy is implemented), the unit of analysis is change in the community-wide rate, not changes for individual persons.

We encounter this unit of analysis question in many systems, such as research about school-based interventions. Even if we collect data about individual students, the unit of analysis might be:
- teacher/classroom (aggregating across 25 or more students to learn about an intervention at a school),
- school (aggregating across classrooms to learn about an intervention in a school district),
- school district (to learn about an intervention with a state school system), or
- school systems (to learn about an intervention at the national level).
These may seem like subtle distinctions but understanding unit of analysis issues is important in terms of study design, measurement, and data analysis strategies.
The special case of measuring intervention fidelity.
The importance of adhering to an intervention protocol has been previously discussed. You learned that it is important to monitor how well an intervention’s delivery adheres to the tested intervention protocol, and that this is assisted by staff training, detailed manuals, and routine process monitoring. Social work interventions at macro levels, such as policy changes, are no different in terms of the importance of monitoring fidelity or adherence in their implementation. The logic model for a policy-level intervention should have included the steps, processes, and output indicators associated with the policy. Monitoring these steps and processes is a form of fidelity assessment. For example, a federal policy to help address homelessness and families at risk of becoming homeless is known as the Section 8 Housing Choice Voucher Program. The policy was designed to provide resources to low-income families to secure housing in their local community’s private market. The policy has numerous rules and guidelines concerning who is eligible to receive the vouchers, who can administer voucher programs, and different types of vouchers. Assessing fidelity to the policy would require tracking how communities perform along each of these different dimensions. In addition, it would be wise to assess barriers to their implementation, factors such as natural disasters and economic trends that affect affordable housing availability. As survivors of the 2018 Camp Fire that decimated most of Paradise, California can attest, just because funds are available does not mean that housing is available.

It is important for intervention and evaluation investigators to consider how variables associated with fidelity to intervention at any level (micro, meso, macro, or global) will be measured. A search of the literature may or may not result in identifying a strong set of tools for measuring fidelity. This is an area of intervention research and measurement science that is not yet as well developed as others. Thus, investigators and evaluators may need to be creative in developing their strategies for tracking and measuring intervention fidelity.
These steps should assist in developing a fidelity tracking/measurement plan.
- Identify the critical components of the intervention that need to be assessed for fidelity. For example, this might mean specific content/information/topics being covered, screening or assessment being conducted, feedback being delivered, resources being shared, referrals being made, or other critical features.
- Identify key indicators for each critical component having been delivered. This might be in the form of client or practitioner checklists, review of case notes, supervisory review of a recorded session, or other strategies.
- Specify a sampling plan for tracking fidelity. For example, fidelity might be assessed for every contact with every participant, a random sample of contacts for each participant, or routinely for the first, middle, and final contact with a random sample of each practitioner’s clients.
- Specify a measurement plan for tracking each key indicator.
Simple accounting measures.
An intervention protocol may call for a specific number, amount of time, frequency/pace, or duration over time of client contacts. For example, a batterer treatment program might require participants to attend a minimum of 24 2-hour group sessions and 8 1-hour individual counseling sessions during a 28-week period to meet court-ordered requirements. This type of information is relatively easy to track through administrative, scheduling, attendance, staff service, or billing data. These objective data, however, do not provide information concerning what transpired during those group or individual counseling sessions. More complex measures of fidelity are needed for this purpose.

Complex fidelity measures.
In many instances, the critical elements of an intervention involve how a session progressed and the qualities of the interactions, rapport, and transactions between the provider and client. In other words, determining not only THAT something transpired, but HOW it transpired. Consider, for example, interventions delivered through motivational interviewing (MI):
“Motivational interviewing (MI) is an empirically supported intervention for substance abuse and other behavioral problems. However, for this intervention to work, it must be provided with fidelity and skill” (Madson & Campbell, 2006, p. 67).
A systematic review of MI and motivational enhancement literature resulted in the identification of five measures for assessing practitioner fidelity to a psychotherapy or MI delivered intervention (Madson & Campbell, 2006). For example, the Motivational Interviewing Skill Code (MISC) requires a skilled rater to code videotaped MI sessions between a practitioner and client. The MISC rater codes the following:
- the practitioner’s behavior globally throughout the MI session, elements deemed critical to implementing MI (acceptance, egalitarianism, empathy, genuineness, warmth, and the “spirit” of MI)
- client behavior globally across the session (affect, cooperation, disclosure, and engagement)
- interactions globally between the practitioner and client across the session (level of collaboration and benefit of the interaction)
- each therapist utterance (affirming, confronting, open or closed questions, reflection types, or reframing)
- each client utterance (asking questions, neutral response, resisting change, or change talk)
- amount of time the practitioner and client engaged in talk during the session.
As you can imagine, a 45-minute session might require hours of time for coding using this fidelity measure. While this measure might help assess the practitioner’s adherence (fidelity) to the MI intervention protocol, it is difficult and resource intensive (expensive) to use. Furthermore, it may be difficult to locate a rater qualified to evaluate MI sessions with strong reliability in this deconstructed manner. And, as a research measure used to assess fidelity, it is important to learn more about this measure’s validity and reliability (psychometric) properties (Madson & Campbell, 2006). Let’s review what this means for measurement in general.

Measurement Validity & Reliability Revisited and Extended
In our prior course (Module 3, chapter 5), we examined issues of measurement validity and measurement reliability in quantitative research. In our previous course, we discussed measurement validity and reliability as indicators of an instrument’s measurement accuracy. Measurement validity and reliability are important to all quantitative measurement efforts and continue to be relevant in intervention and evaluation research. We have additional issues to address, as well: measurement sensitivity, measurement specificity, and the use of clinical screening and assessment tools intervention and evaluation research.
Measurement validity.
Measurement validity is an index of the extent to which a measurement tool adequately measures the concept, construct, or variable that it purports to measure (Grinnell & Unrau, 2014; Perron & Gillespie, 2015). If we believe that we are measuring a construct, validity is concerned with whether we are actually measuring that construct, factor, or variable. It concerns whether our measurement is on target, but also whether our measurement is robust enough to cover all or most of the dimensions of that construct. With validity, we need to determine whether we are measuring an underlying ability/capability/capacity or simply measuring a performance. For example, in a quiz on this course material, do you feel that your true ability to work with the material is reflected in your performance? There exist many reasons why a person might not perform at top capacity on any measure—situational, context, motivation, and other reasons.

An important consideration in measurement validity relates to cultural relevance and inclusiveness. In our earlier course we discussed the problem of using human intelligence tests with a gorilla (Koko); one criticism of traditional intelligence and mental illness diagnostic measures concerns analogous cultural bias built into the instruments.
“Many tests have been objected to, as they produced poor results for the ethnic or racial minorities (students), as compared to the racial majorities. The problem lies not with the test-taker, but with the test itself” (https://psychologenie.com/understanding-cultural-bias-with-examples).
An example presented in a test designed to demonstrate this point is the question: “What number comes next in the sequence, one, two, three, _____?” Those of us from majority culture would respond “four.” However, the “correct” answer in this test is “mong” (translated as “many”) because this is an “Original Australian Test of Intelligence” and the counting system in this culture can be translated as “one, two, three, many” (the word mong meaning numbers from 4 to 9 or 10, http://www.wilderdom.com/personality/intelligenceOriginalAustralianAnswers.html). While this example may seem extreme, analogous cultural biases appear in many measures used in quantitative research. It is important that this phenomenon of cultural bias be assessed with the tools investigators wish to use, at least in terms of the use with the populations investigators wish to study.

For example, investigators wished to use the Beck Hopelessness Scale in research with youth living in Kenya (Kagotho, Bowen, Ssewamala, Vaughn, & Kirkbride, 2018). Originally, the Beck Hopelessness Scale was developed in western culture, as part of the Beck Depression index (Beck, Weissman, Lester, & Trexler, 1974). The first challenge was to translate the instrument into the youths’ national language (Kiswahili). To ensure adequacy of the translation, the translation was then translated back to English to ensure that the original and re-translated versions remained consistent. Next, the investigators collected data with 3,965 Kenyan students (aged 9-18 years) from 5 regions of the country. (When offered their choice, all the students opted to complete the English version.) Investigators analyzed the instrument’s psychometric characteristics of the 20-item true/false question instrument using these data. They concluded that the Beck Hopelessness Scale remains a valid measure in use with this non-western population. Furthermore, the students’ responses appeared not to systematically vary as a function of age group, meaning that it is reasonably valid for both the younger children (aged 9-12 years) and the older youth aged 13-18 years).

While these two examples (aboriginal Australia and sub-Saharan Kenya) represent differences between western and other cultures, differences exist within a country, state, city, or local population, as well—anywhere that human diversity exists. Consider, for example, the differences in candidates’ yard signs you see in single neighborhoods at the time of an election. “Cultural” differences are relevant in measurement regarding many dimensions of human diversity beyond race, ethnicity, language, and national origin—for example, sex, sexuality, and gender identity; ability and disability; age; income and socio-economic status; religion and spirituality; and, the intersections among these dimensions.
Measurement reliability.
Measurement reliability is an index of the extent of instrument’s stability and consistency in performing its measurements. Three aspects of measurement reliability are important to consider in research: test-retest, internal, and inter-rater reliability.
Test-retest reliability:
A measurement instrument’s test-retest reliability is especially important in longitudinal intervention or evaluation research. The idea here is that the measure is consistent over time, when time is the only variable that is known to change. Using the instrument or measure at one time point should provide the same result as using it again at a different time point with the same individuals. Consider a yardstick—if you measure the height from the floor to your hip you expect to obtain the same result today, tomorrow, and the next day as long as all other conditions remain unchanged (same type of flooring, same footwear, and same point on your body). In social and behavioral research we aim for the same degree of consistency in measurement.

Let’s examine an example that a social worker might use in studying an intervention designed to prevent or address intimate partner violence in dating relationships among adolescents (Wolfe, et al., 2001). The authors embarked on this effort to develop an age-appropriate measure, the Conflict in Adolescent Dating Relationships Inventory (CADI), because the instruments typically used with adults in relationships were not particularly relevant or valid in work with adolescent relationships. As part of a four-study series to assess the measure, they conducted a two-week test-retest reliability study with 70 students in 9th through 11th grades. This means that participants completed the measure at one time point and again two weeks later. The reliability over time was indicated in a correlation coefficient (r=.68 for abuse, r=.75 for restricted abuse). This is reasonably strong test-retest reliability (a positive correlation, far from 0 and closer to 1). Intervention and evaluation researchers rely on strong test-retest reliability in measures because it allows them to conclude that differences in scores between two time points can be attributed to the intervention rather than to inconsistency in the measurements.
Internal consistency:
Internal consistency is about getting similar responses to similar items on a multi-item measure, and is sometimes called internal reliability. This information conveys to investigators how well items that should be providing similar results do provide similar results. For example, if you wanted to measure client satisfaction with the services received, you would probably ask about satisfaction on several different dimensions of care, and use multiple items about each of those dimensions, rather than ask one single satisfaction question. Internal consistency would be present if the multiple satisfaction responses about one dimension were similar, even if satisfaction about different dimensions differed. In other words, how well items in a single group fit together based on how people responded to the measure.

Looking once again at the Conflict in Adolescent Dating Relationships Inventory (CADI), the investigators analyzed internal reliability of the measure’s items on five subscales or groupings of items that should, in theory, have elicited similar responses from the study participants (Wolfe, et al., 2001). The statistic they reported is called Cronbach’s alpha (using the same α symbol we have seen previously to designate alpha) which is low when close to 0 and high when close to 1. The group of items related to verbal or emotional abuse were acceptably related (α=.82), as were the items related to physical abuse (α=.83); items for threatening behavior were not as internally consistent (α=.66), relational aggression (α =.52), or sexual abuse (α=.51). An intervention investigator might decide to use this instrument to study verbal/emotional and physical abuse, but perhaps not the other forms of relationship aggression.
Inter-rater reliability:
The topic of inter-rater reliability has been discussed in our previous readings as inter-rater, inter-coder, and inter-observer reliability. While internal consistency is about the degree of consistency in the participants’ responses, inter-rater reliability is about the degree of consistency in how responses are coded or rated by investigators observing participants’ behavior. This construct is important in all forms of measurement where the data are formed from observations rather than collected from the target individuals themselves. For example, parents and teachers or fathers and mothers or grandparents and parents might provide different judgments of a child’s behavior. The more similar their judgments, the greater their inter-rater or inter-observer reliability, and the more confidence investigators have in the ratings provided using that measure.

A variation on this theme was introduced in the study concerning the Conflict in Adolescent Dating Relationships Inventory (CADI): since this is a measure describing a relationship between two persons, the investigators also looked at the degree of partner agreement in rating their relationship (Wolfe, et al., 2001). They report that, in general, agreement between the male and female dating partners in describing their relationship was “fairly good” (p. 285) and that no significant differences were observed in the level of abuse partners reported in their relationships (p>.05 on a paired-t test, so they did not reject the null hypothesis of no difference).
Measurement sensitivity & specificity.
In assessing the measurement tools investigators might utilize, it is important to consider instrument precision. There are two sides to this precision issue: measurement sensitivity and measurement specificity. This discussion takes us back to prior discussions about probability: the probability of properly classifying individuals or individual cases using a clinical tool. This situation concerns clinical tools that identify individuals or cases dichotomously: positive or negative for the condition of interest. For example, a tool might be designed to determine if individuals meet criteria for depression (positives) or fail to meet the criteria (negatives).
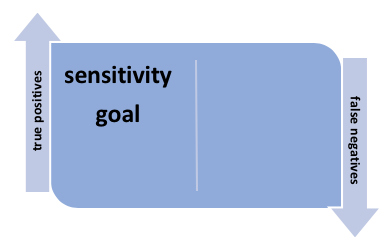
Sensitivity.
Measurement sensitivity concerns achieving the highest possible rate of accuracy in detecting the problem of interest. In other words, the percentage of individuals identified as meeting the criteria, classified as “positive,” would be as close as possible to 100% of those who actually have the condition or problem. In other words, the goal with sensitivity is to maximize identification of true positives and minimize the number of false negatives (those who are classified as not meeting criteria but who actually have the condition of interest). At-home pregnancy tests, for example, ideally report “positive” results and do not report “negative” results for women who are pregnant–true positives are identified and false negatives are minimal.
For example, investigators recently compared the sensitivity of two depression measures when used in mental health screening of adult Mexican American women (Valencia-Garcia, Bi, & Ayón, 2017). They found that one measure (the Kessler Psychological Distress Scale, or K-10) had a significantly higher degree of sensitivity than the other (depression questions on the Composite International Diagnostic Interview, Short Form, or MDD CIDI-SF) when the clinical “gold standard” of the Patient Health Questionnaire (PHQ9) was used as the comparison classification tool: 81.1% of those screened as positive for depression on the “gold standard” PHQ9 also were classified as positive on the K-10 compared to only 56.8% with the MDD CIDI-SF instrument. In other words, sensitivity of the PHQ9 was deemed better than the MDD CIDI–true “positives” were better identified and “false negatives” were fewer.
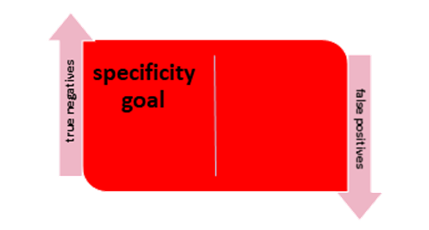
Specificity.
On the other hand, it is equally important to make sure that the measurement instrument excludes as many individuals as possible that do not meet the criteria. In other words, the goal with specificity is to minimize the “false positive” (individuals without the condition being incorrectly classified as positive) and maximize the “true negative” rates (individuals without the condition being properly classified as negative). At-home pregnancy tests, for example, would hopefully show “negative” results and not show “positive” results for women who are not pregnant.
Let’s turn back to the example of the study comparing depression measures used with Mexican American women (Valencia-Garcia, Bi, & Ayón, 2017). The investigators found that the measure identified as being more sensitive (correctly identifying women with depression) also had significantly worse specificity: the K-10’s specificity was 78.6% and specificity of the MDD CIDI-SF was 88.7%. In other words, the K-10 did not do as well as the other measure in identifying women who did not have depression based on the PHQ9 “gold standard.” The authors’ conclusion: the two measures appear to be complementary and perhaps both should be used when screening for depression in this population.
Measuring Change
A significant way in which intervention and evaluation research differ from the kinds of research we explored in our prior course revolves around what, exactly, is being measured. In any type of research, investigators might be interested in measuring outcomes related to a behavior, characteristic, or other dependent variable (y). In intervention and evaluation research, however, the focus is on measuring change in dependent (outcome) variables. This has important implications for the measurement plan.
Sensitivity to change.
First, investigators need to ensure that the measurement tools are sufficiently sensitive to detect even small changes. For example, imagine that a brief school-based program for students experiencing clinically diagnosable depression is being evaluated. Assuming the evaluators selected a depression measure that is categorical in nature: an individual is either scored as clinically depressed or not clinically depressed. At the brief program’s conclusion, it may be that very few (if any) of the student participants seemed to have improved on the depression measure—moved from the clinically depressed to not-depressed category. However, if the evaluation team selected a scaled depression measure with 50 points ranging from “no depression” (0) to “severe depression” (50), it is quite possible that the investigators would observe progress in terms of a significant downward trend in the values of the depression scores for the program participants. One measure leads to the conclusion that the program was a failure and waste of resources, whereas the other measure leads to the conclusion that significant improvement is possible with the brief program, even if many students remained above the threshold for a clinical assessment of depression. The scaled measure is more nuanced and sensitive to change and may be a better choice than categorical measures to answer research questions associated with evaluation or intervention research.

Clinically or statistically significant change.
Second, investigators need to understand the difference between statistically significant change and clinically significant change. Going back to our example of the school-based depression program, the evaluation team might observe a statistically significant decline in depression scores among program participants: perhaps the mean score dropped from 44 to 42. While this change might have been statistically significant (leading investigators to reject the null hypothesis of no difference), was the change meaningful in a real-world or clinical way? Would a social work practitioner and the students, their parents, siblings, and friends/peers notice an average 2-point improvement? Hypothetically, it might require a 10-point difference on this depression measure before clinical significance or meaningfulness is achieved. Clinical significance gets at the issue of what is a relevant amount of change, beyond what is statistically significant. In terms of measurement, it is important to know how much difference or change would be clinically meaningful with the instruments used.

Validity for measuring change.
Third, investigators need address the possibility that changes in scores on their measures are validly measuring change and not some other difference phenomenon. For example, imagine that investigators want to know whether an intervention helps improve problem solving abilities among aging persons without dementia. They might choose a measurement tool that is based on how fast a set of puzzles can be solved (a timed-trial). If they administer the very same puzzles before and after the intervention, they may see significant improvement in the participants’ solution times the second time around. However, the improvement may not be a (sole) result of the intervention: it may be that participants figured out and learned the puzzles the first time and were able to remember how to solve them faster the second time. This problem is a test recall effect (rather than measuring a real change in participants’ capability), and the investigators might draw the wrong conclusions about the impact of their intervention based on these results.

Locating Data Sources
Before exploring sources for locating measurement tools, let’s revisit the topic of sources of data. In research for understanding social work interventions, investigators have a number of options for locating available data (Kapp & Anderson, 2010). Working with available data eliminates or reduces the need for time and resource intensive data collection and can reduce participant burden for providing new data. Secondary data may not help answer an investigator’s evaluation research questions since the questions are about a specific program or agency and the secondary data were likely collected elsewhere and may originally have been collected to answer a different research question. The secondary data may help inform the local evaluation effort and measurement strategy, but local data is desired for answering local research questions.
On the other hand, administrative data is a form of available data commonly collected by the agencies, programs, and institutions being evaluated locally. While pre-existing, available data may seem like a gift to investigators, it is important to assess their usefulness. Investigators might consider three types of available and administrative data (Kapp & Anderson, 2010):
Systematically gathered administrative data.
Administrative processes generate a variety of forms of data that may be helpful in evaluating a program. For example, data concerning the number, frequency, duration, and timing/intervals of client contacts with the program and service delivery team members may be present in routine billing documentation. Certain demographic information might be available in client records, as well. For example, clients’ ages can easily be calculated from their birth dates. At the organization level, records are maintained concerning staff delivering the interventions—their qualifications, percent effort directed to the intervention being evaluated, cost of delivering the services, and more.

Treatment documentation.
Available data might also include information located in the records or case files for each client served. Individual records may include information in the form of screening and clinical assessment reports, case notes and treatment/service plan recorded by practitioners delivering services, case history details recorded in the client record over the course of intervention, critical incident reports, and other documentation about the intervention’s process, fidelity, and outcomes. These sorts of data (often qualitative in nature) can be more difficult and time consuming to extract than most administrative data, however these data are often very rich and more accurate than retrospective data since they are recorded at the time of events happening (Kapp & Anderson, 2010). This type of information is typically located in client records because social work practitioners are trained to link intervention plans to assessment results and are encouraged to use evidence-supported assessment tools in this process (Jordan & Franklin, 2003).
Consider the possibility that investigators wish to understand client termination from an intervention program. It is difficult to obtain information from individuals who are no longer participating in an intervention, so client records may be a source of information about what preceded departure from the intervention: was it because their goals had been successfully achieved or were other factors suggestive of a pattern in client dropout? Recently, a social work student designed a study around this question, using client case records as the source of her data to determine if there existed patterns in dropout among young men in residential treatment for sexual offending behavior (Brenner, unpublished honors thesis project). She reviewed all 94 case records for past clients in the program, coding the information on completion status (successful, unsuccessful), level of family’s involvement in the treatment process (low, moderate, high), scores on the intake Juvenile Sex offender Assessment Protocol (J-SOAP), adoption or foster care history (yes/no), and victim type (sibling, friend, other). She found that low scores on the J-SOAP and high levels of parental involvement significantly predicted successful program completion.

Clinical or administrative judgments.
This category, as described by Kapp and Anderson (2010), is vague compared to the other types but has important implications for how evaluation results are interpreted. This type of information is closely tied to issues of intervention process, context, and fidelity. Evaluation investigators might record practitioner, staff, and administrator observations about the service delivery process. These observations might be presented or discussed in staff meetings or supervision sessions and may be reflected in formal or informal communications (e.g., internal agency memos, procedural guidelines, email conversations, and other artifacts). These types of information are particularly helpful in evaluating the implementation surrounding a new intervention or the modification of an existing intervention.

Working with secondary and administrative data has the previously noted drawbacks: investigators cannot be certain about data quality as its collection may not have been routinely monitored, and investigators are limited to what was being collected rather than being able to precisely tailor the data collection tools to the variables of interest. Thus, they may need to rely on proxy variables in their research efforts. For these reasons, intervention researchers and evaluators may wish to rely on primary data collection strategies instead or in addition. This leads us to a discussion of where one might turn to locate measurement tools for intervention and evaluation studies.
In order to refresh your memory of working with Excel, we have an activity in the Excel Workbook related to how variables appearing in an administrative data set might be transformed into variables suited to conducting an evaluation analysis.
Interactive Excel Workbook Activities
Complete the following Workbook Activity:
Locating Measurement Tools
In our prior course, you read about a few places where you might search for measurement tools that might be useful for intervention or evaluation research studies—particularly screening and assessment tools (Module 3, Chapter 5). First and foremost, you could turn to the literature. Surveying the articles published by other investigators on the topic, intervention, population, or variables of interest is a great place to start. For example, in our prior course you learned some electronic search terms that help investigators and practitioners locate pre-existing measures on a specific topic: tests, measures, measurements, assessment(s), scale(s), and screening.
In addition, you were introduced in our prior course to a variety of tools for locating and selecting general measurement tools. For example, the Mental Measurements Yearbook (Carlson, Geisinger, & Jonson, 2017). You also were introduced to several that are specific to measuring variables that might be of interest in efforts to understand social work interventions. These and others include:
- Handbook of clinical rating scales and assessment in psychiatry and mental health (Baer & Blais, 2010)
- Handbook of family measurement techniques, v. 1-3 (Touliatos, Perlmutter, Straus, & Holden, 2001)
- Handbook of psychiatric measures, 2nd ed. (Rush, First, & Blacker, 2008)
- Handbook of research design and social measurement, 6th ed. (Miller & Salkind, 2002)
- Measures for clinical practice and research, 5th ed, v. 1&2 (Corcoran & Fischer, 2013)
- Positive psychological assessment: A handbook of models and measures (Lopez & Snyder, 2003)
- Rating scales in mental health (Sajatovic & Ramirez, 2012)
- Outcome measures for child welfare services: Theory and applications (Magura & Moses, 1986)
- Measuring violence-related attitudes, beliefs, and behaviors among youths: A compendium of assessment tools (Dahlberg, Toal, & Behrens, 1998).
Cautionary reminder.
In the earlier course you learned two important cautions related to the use of clinical screening and assessment tools as research measures.
- The need for procedures to provide their test results to each study participant.
- The need to determine how to work with the scores obtained using clinical measures—whether actual scores can be used as a scale variable or if scores can only determine the related to whether or not the person meets criteria for the condition being studied (dichotomous yes/no data).
Norms.
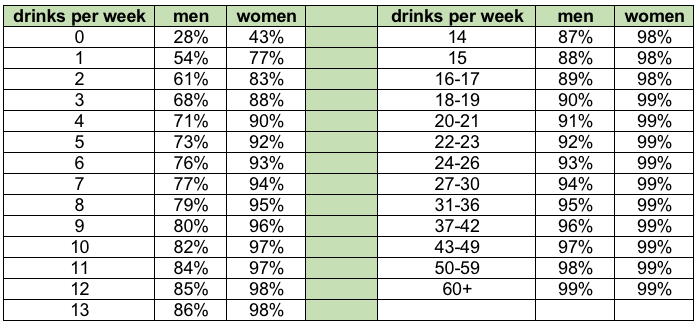
An important third consideration concerns the availability of standardized norms for the measure, particularly when applied with the population of interest. Normed scores provide a context for interpreting clinical screening and assessment scores by providing information about how others have scored on that measure (Jordan & Franklin, 2003), and are an important part of providing social work clients with personalized normed feedback about the behaviors being screened or assessed. For example, the following chart was used to provide personalized feedback to participants’ responses concerning the number of drinks containing alcohol they consumed in an average week (Miller & Mattson, 2004). It offers men, women, practitioners, and researchers comparative values on this variable. A man who consumes 20 drinks per week is consuming more alcohol than 91% of other men in the United States; a woman who consumes 20 drinks per week is consumer more alcohol than 99% of other women. This information might be a big surprise to men and women who drink the same or less than their drinking buddies; it can help them reevaluate their own drinking behavior as being non-normative compared to the general population.
Table 3-1. Alcohol consumption norms for U.S. adults (based on 1995 National Alcohol Survey, adapted from Miller & Mattson, 2004)
Normed scores also help determine clinical cutpoints for categorizing individuals as meeting or not meeting problem criteria. In other words, where to draw the line for categorizing their scores into the dichotomous “yes” or “no” groups. For example, the AUDIT (Alcohol Use Disorders Identification Test, Babor, Higgins-Biddle, Saunders, & Monteiro, 2010) has two different cut points based on population norms for screening individuals for a possible alcohol use disorder. Originally, the normed cutpoint for the AUDIT was a score of 8 or greater. More recently, authors suggested that the normed cutpoint for women should be a score of 7 or greater instead, and that the normed cutpoint of 8 remains suitable for men.

Chapter Conclusion
In this chapter you reviewed several important topics related to measurement and extended what you know about these topics as they apply to intervention and evaluation research. These included the relationship between measures and variables, types and levels of variables, unit of analysis issues, measurement validity and reliability, and how to approach locating intervention and evaluation research measures. The expanded topics included instrument sensitivity and specificity, measuring intervention fidelity, measuring change (sensitivity to change and clinically significant change issues), considering the use of administrative data, and the importance of norms when clinical screening or assessment tools are used. In addition, you dusted off your skills in working with Excel on two data-related exercises: one concerning data entry for different variable types, the other about transforming variables that might appear in administrative data for use in an evaluation effort. The remaining topic in this module concerning design issues concerns study participants, the topic of our next chapter.
Stop and Think
 Take a moment to complete the following activity.
_
_
_
_
_
_
_
