SWK 3401.4-3.1 Computing Confidence Interval for the Mean (CI95%)
Introduction
The purpose of this activity is to learn how to interpret the information about skew and kurtosis that Excel provides. We will work with the output from our earlier descriptive statistics analysis of the student absenteeism data.
Instructions
- Open the file called student absenteeism start.xlsx for this analysis.
- Two pieces of information will need to be computed to complete this task. We need to know the mean and the confidence value. This is because the Confidence Interval is computed as the mean minus the confidence value computed by Excel as the lowest part of the range, and the mean plus the confidence value as the highest part of the range. In a formula version, it looks like this:
CI95% = Mean ± Confidence Value or
CI95% = (Mean – Confidence Value, Mean + Confidence Value)
- Finding the mean is somewhat familiar—you did this in an earlier exercise. Click on the Data tab, then double click on Data Analysis (all the way on the right). A menu of statistical analysis tools opens for you, and you want to select the one called descriptive statistics. In the menu box, you want to select the input range for our days absent variable, which was the “B” column, rows 2 through 29. So, the input range you type into the space is going to say B2:B29
- In this menu, you may also notice four check boxes below the choice of where the output is produced (we have been selecting “New Workbook Ply” as the preferred option. One of these that you want to check is the “Summary statistics” box. The other that you want to check is the “Confidence Level for Mean” which defaults at 95%. This asks Excel to compute that confidence value that we are seeking.
- The output produced by Excel should look like this (after widening the columns by dragging the vertical lines a bit to the right):
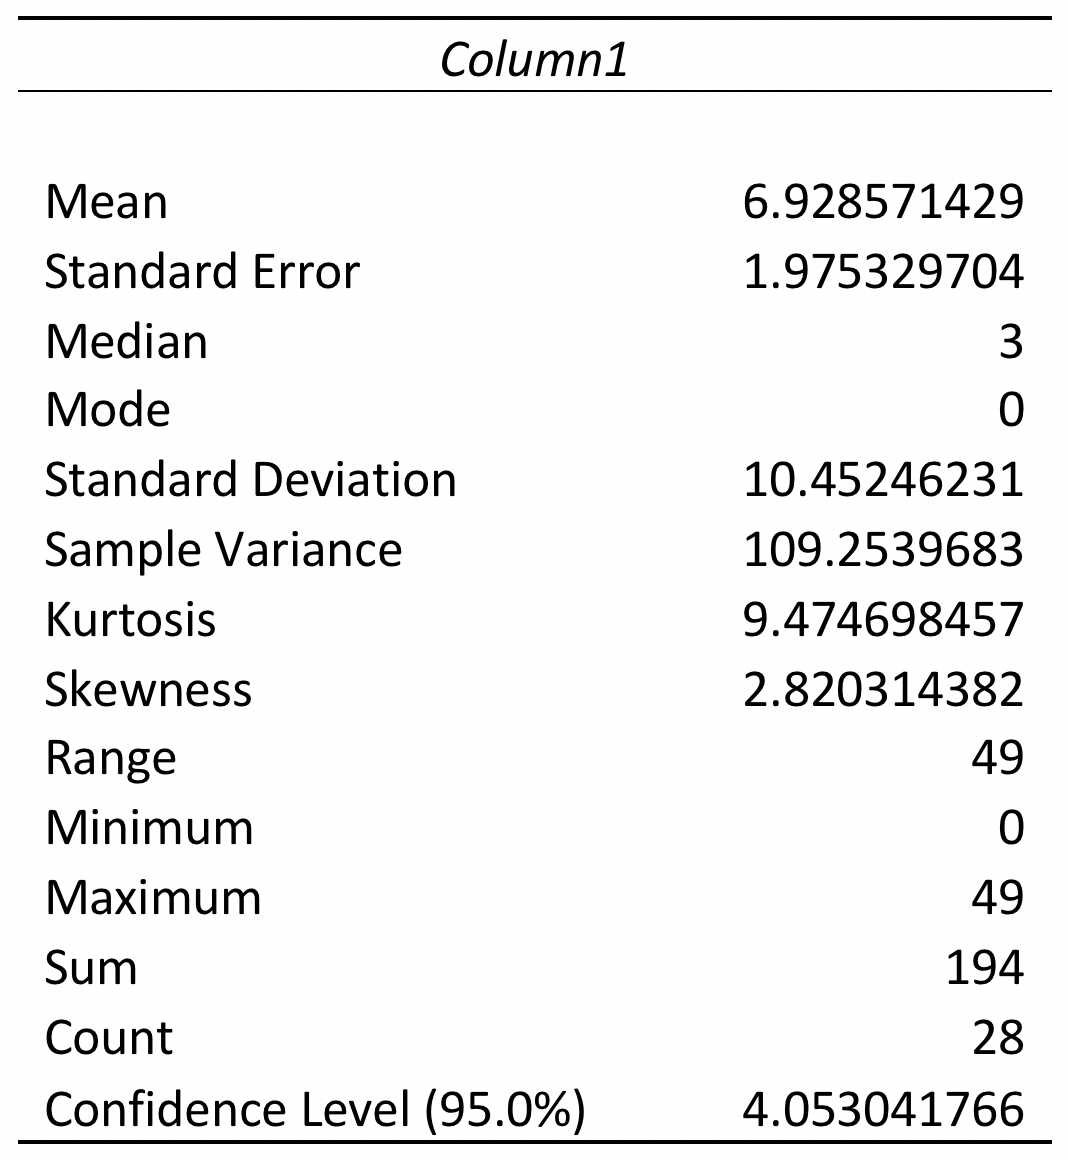
- Next, you could use a calculator to compute the confidence interval “by hand,” plugging the values for the mean and 95% confidence level into the formula.
CI95%= Mean ± Confidence Value
CI95%= 6.93 ± 4.05 or
CI95%= (6.93 – 4.05, 6.93 + 4.05)
CI95%= (2.88, 10.98) - The other option is to make Excel do the math. First, the sum value is easy. Simply click on a new empty cell in your sheet2 output, perhaps cell A19. Then click on the ∑AutoSum in the top menu bar (over on the right). In the drop-down menu, select the “Sum” option. In your cell you will see Excel start to fill in the syntax for your request. Your mean value is in cell B3, and your Confidence Level value is in cell B16. Therefore, inside the ( ) you will type B3,B16. NOTE: USE THE COMMA (,) NOT THE COLON (:), because you want these two cells only, not the range of cells between them! So, the syntax will look like this:=SUM(B3,B16). The resulting value is 10.98 in cell 19.
- The subtraction value is more complicated because Excel lacks a ‘subtract’ or ‘difference’ computation command. Instead, we need to simply plug in the actual known values using “-“ between them. To complete this step of the process, click on a new empty cell in your Sheet2 output—perhaps cell C19. Then the syntax that you type into this cell is going to be: =6.93-4.05 which is what you would have put into a calculator. (We could have done the previous addition step this way, too: =6.93+4.05). The result of our subtraction request should be 2.88.
- Thus, our 95% confidence interval for the mean number of days absent is:
CI95% = (2.88, 10.98). - If you were able to obtain these values, then you have successfully completed this learning activity!
