SWK 3402.4-2.1 Paired t-test Analysis Exercise
INTRODUCTION
The purpose of this activity is to learn how a paired-ttest is conducted and interpreted using Excel program features. For purposes of this exercise, a hypothetical data file was created by modifying a data set manufactured to accompany the SPSS Survival Manual, 6thedition(Pallard, undated). The story behind these data is as follows:
These data represent a fictitious intervention study testing the impact of two different types of interventions for helping social work students manage anxiety about learning statistics in their two-course understanding research and statistics sequence. Fifty students were divided into two equal groups (n=25 each group) and asked to complete a statistics stress measure before the course began (Time 1). One group (Group 1) was supported with a remedial “back to basics” training to improve mathematical skills and build confidence in the ability to master the statistics content. The second group (Group 2) was supported with exercises to de-stress as they work with the challenging content—relaxation response breathing, body tension release exercises, and comfort snacks. At the end of the support programs (Time 2), students again completed the statistics stress measure. Performance on the final course grade was also recorded for each student.
The social work faculty investigator was interested in answering two types of research questions. First, was there a difference in outcomes related to the two intervention approaches. Second, was there a significant change in statistics stress from Time 1 to Time 2 for either or both groups. The first question was answered using an independent samples t-test with the Time 2 data: the mean statistics stress scores for Group 1 (math skills support) was significantly lower than for Group 2 (relaxation support): Mgroup1=3.00,Mgroup2=3.84, t(48)=-2.436, p<.05. Another independent samples t-test demonstrated no significant difference in final course grade for the two intervention approaches: Mgroup1=86.25,Mgroup2=82.54, t(48)=1.637, p>.05. Thus, the instructor rejected the null hypothesis of no difference in stress and failed to reject the null hypothesis of no difference in final grade. The instructor concluded that math skills support was preferable as an intervention for addressing social work students’ experience of stress concerning statistics, but that neither intervention was significantly better than the other in affecting final course grades (Remember: This is a completely hypothetical study!!!!)
Next, the instructor needed to determine if the post-intervention stress scores were significantly different from the students’ pre-intervention stress scores. Because the data are longitudinal (Time 1 and Time 2 were collected from the same students and can be matched case-by-case), a repeated measures analysis is necessary: the paired-ttest was appropriate since exactly two groups were compared. The null hypothesis is as follows (it is actually 2 null hypotheses, rather than a double-barreled single statement):
H0: No significant difference exists between Time 1 and Time 2 stress for Group 1 (math skills support intervention group).
H0: No significant difference exists between Time 1 and Time 2 stress for Group 2 (relaxation support intervention group).
Let’s work both paired t-test analyses for these data.
INSTRUCTIONS
- Open the file called “statstresspairedttest.xlsx” in Excel.
- Just as in the case of the independent samples t-test and the Anova, we find that our data are not arranged quite as needed for the comparison analysis. Excel needs the data for Time 1 in one column (as if it is its own variable) and data for Time 2 in another column. The first step is to sort the data by group so that we can easily grab the values for each group and copy them into separate columns.
- Next, select “data” from the top menu bar and “sort” from the dropdown menu. Fill in the sort by box with the “group” variable, leave the cell values (sort on) and smallest to largest (order) defaults as they are. When you click “ok” you should see your data reorganized with all the Group 1 data in rows 2 through 26 and the Group 2 data in rows 27 through 51.
- Copy and paste the data from column C, “prestress” variable, for only the Group 1 cases, cells C2:C26 into a new column—try labeling cell J1 as g1prestress and place the copied data into cells J2 through J26.
- Copy and paste the data from column F, “postress” variable, for only the Group 1 cases, cells F2:F26 into a new column—try labeling cell K1 as g1prestress and place the copied data into cells K2 through K26.
- Repeat these two steps for the Group 2 data, placing the prestress data from cells C27:C51 into column M, labeling cell M1 g2prestress. Then, pace the postress data from cells F27:F51 into column N, labeling cell N1 g2postress.
- Now that the data are properly configured, it is time to conduct the paired t-test analysis. In the toolbar, select “Data Analysis” in the far-right corner. In the list of options in the dropdown box, select t-Test: Paired Two Sample for Means.
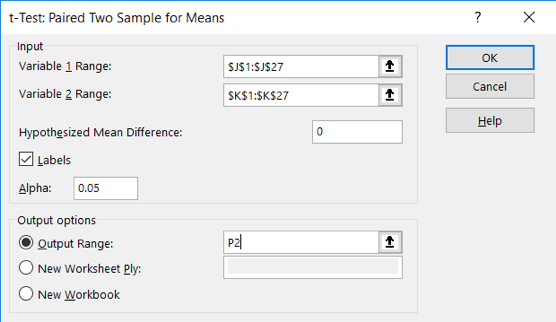
- The box for Variable 1 range should be your Group 1 prestress values in column J. So, this should be cells J1:J27 and the box for Variable 2 range should be your Group 1 postress values in column K, cells K1:K27.
- The hypothesized mean difference in our null hypothesis is no difference, so this box should have 0 (zero) entered. We included cells J1 and K1 so that we would have labels in our output, so the box for “labels” should be checked. We like the default alpha of 0.05, so we leave that alone. Our output should start in an empty area of the sheet, so perhaps enter P2 here. The box should look like this before you click on “ok.”
- Voila! The paired t-test results should appear. Let’s take a look… The Group 1 mean stress scores before math skills support was 4.04 and after the course was down to 3.0. The paired t-test results would be reported as t(24)=4.308, p<.001. We used the 2-tailed value because our null hypothesis did not specify a direction of difference, only a difference. Thus, the investigator should reject the null hypothesis of no difference and can conclude that the students stress values in the math skills support group were lower at the end of the course than at the start of the course.
- The investigator wished to complete the analysis to see if the relaxation intervention was also associated with similar benefits. If it was, then the improved stress scores might not be a function of either intervention, they might be a function of naturally occurring processes like maturation or natural/spontaneous change. So, let’s conduct the second paired t-test analysis, the one for pre/post stress scores in Group 2.
- Click data analysis, t-Test Paired Two Sample for Means, and replace the variable 1 and variable 2 ranges with the cells where Group 2 data are located: M1:M27 for the “pre” scores and N1:N27 for the “post” scores. A new empty area of the spread sheet should be identified for the output range—try starting it in cell P20. Your command box should look like this before you click on “ok.”

- Ta-da! We see that the mean stress scores for Group 2 pre and post were 4.08 and 3.84 respectively. We also see that t(24)=1.809, p>.05 (the two-tail value was 0.08 which is greater than our criterion of .05). In this case, the investigator should fail to reject the null hypothesis of no difference. It seems that there is possibly no significant improvement on statistics stress observed with the relaxation intervention.
- If you were one of these hypothetical students in the hypothetical class with the hypothetical interventions being offered, you might prefer to select the math skills support intervention if your goal is to reduce statistics stress. Feel free to compare your output to the file called “statstresspairedttestfinish.xlsx”. If you achieved similar results, you have completed this paired t-test learning exercise. Congratulations!
