SWK 3402.3-4.1 Exercise on Sample and Effect Sizes
INTRODUCTION
The purpose of this activity is to observe how effect size and sample size are related. The calculations could be made “by hand” by plugging values into a formula for this task or using an Excel workbook with the formulas inserted. This exercise uses a sample size calculation program available for free use from www.sealedenvelope.com/power/binary-superiority. The example assumes a study design comparing two groups in terms of the percent of successful outcomes (a dichotomous outcome). For example, what percent improvement in the primary outcome measure do we wish to detect in the treatment as usual (TAU) group compared to the percent improvement in the novel intervention (experimental) group? This might be a reduction in post-partum depression scores, increased number of days abstinent from substance use, increased relationship satisfaction, decreased stress, or some other continuous/scale variable scores.
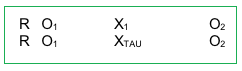
What you will see is how many individuals you would need to plan to recruit and retain (final sample, after any attrition has happened) in each group depending on how great a difference you are looking for (effect size). The study design would look like this:
INSTRUCTIONS
- Open the sample size calculation program located at https://www.sealedenvelope.com/power/binary-superiority/
- We wish to work with the traditional behavioral science significance level of α=.05. So the top box labeled significance level (alpha) should be 5%.
- We also wish to work with the traditional behavioral science power level of 0.80—this reflects the probability that you will observe a difference between groups when the difference actually exists. In other words, the probability that you will reject the null hypothesis when you should (avoiding a Type II error). In behavioral science, “It is generally accepted that power should be .8 or greater; that is, you should have an 80% or greater chance of finding a statistically significant difference when there is one” (www.meera.snre.umich.edu/power-analysis-statistical-significance-effect-size). So, you will want to have 80% in the box labeled Power (1-beta).
- The next two boxes are how we will demonstrate effect size—the difference between the two groups. Let’s use 40% improvement for the control group based on what has been observed in the past with the treatment as usual.
- Start with very high hopes for the experimental group—we want to know how many participants will be needed to observe a very large effect size (difference between the TAU and experimental groups). Try putting in 80% for the experimental group and see what happens when you calculate sample size needed to detect a difference of 40% (80% minus 40% becomes a 40% difference).
- Now try some different values for the experimental group—what happens when you are looking for more subtle differences (smaller effect sizes) between the groups? Try changing the experimental group to 70%, 60%, 50%, and 40% (differences would be 30%, 20%, and 10%).
- If you received results reflected in the table below and concluded that detecting small effects requires more study participants than detecting large effects, you successfully completed this exercise. Congratulations!!!
| Effect size (difference between the 2 groups) | Sample size per group | Total sample size needed |
| 40% | 20 | 40 |
| 30% | 40 | 80 |
| 20% | 95 | 190 |
| 10% | 385 | 770 |
