Module 3 Chapter 3: Overview of Quantitative Traditions
Just as there were multiple traditions under the umbrella heading of qualitative research approaches, different types of quantitative research approaches are used in social work, social, and behavioral sciences. In this chapter you are introduced to:
- cross-sectional research
- longitudinal research
- descriptive research
- correlational research
- experimental research.
Cross-Sectional and Longitudinal Research
Research for understanding diverse populations, social work problems, and social phenomena might be conducted either cross-sectionally or longitudinally. As you will see, the decision about using a cross-sectional research or longitudinal research design has a lot to do with the nature of the research questions being addressed, the type of data available to investigators, and a weighing of the advantages and disadvantages of either approach.
Cross-Sectional Research Design. A cross-sectional study involves data collection at just one point in time. It lends itself to research questions that do not relate to change over time but are descriptive, exploratory, or explanatory about a specific point in time. In a study addressing an epidemiological or other descriptive question, for example, the cross-sectional design allows investigators to describe a phenomenon at a single time point. An example might be a study of the prevalence of individuals’ exposure to gun violence in their communities and ratings of collective efficacy for the community (Riley et al., 2017). Survey data were collected from participants at one point in time (2014) in two communities with high rates of violent crime. Collective efficacy was conceptualized as each individual’s perception about formal and informal cohesion in their neighborhood, the strength of social bonds among neighbors, and the ability of community members to achieve public order through informal mechanisms. The team hypothesized an inverse relationship between these two factors: that higher rates of gun violence exposure would correlate with lower scores for perceived collective efficacy. Responses on 153 surveys were analyzed, demonstrating that exposure to gun violence was very high (95% had heard gunshots, 21% heard gunshots at least weekly, over 1/3 had been present when someone was shot). The hypothesized relationship between individuals’ higher exposure to gun violence and their lower perceptions of community’s collective efficacy was observed.
![]()
Cross-sectional research designs are also used in comparison studies where a phenomenon’s expression is compared for two or more groups—groups differing in race or ethnicity, sex or gender identity, geographical location, or other social demographic factors, for example. These studies might also compare groups of individuals who received a certain intervention and those who did not. Or, this design might compare groups of individuals who differ in severity or other characteristics of social work or behavioral health problem. A cross-sectional design was used to answer a question concerning how bipolar disorder might differ from major depressive disorder outside of major mood episodes (Nilsson, Straarup, & Halvorsen, 2015). Investigators compared 49 individuals with bipolar disorder to 30 participants with major depressive disorder at a point in time when each was in remission. Participants were compared on 15 “early maladaptive schemas” which included their self-ratings of abandonment, mistrust, social isolation, defectiveness, failure to achieve, dependence, emotional inhibition, insufficient self-control, and others. The investigators observed statistically different scores between the two groups on 7 of the early maladaptive schemas, with the bipolar diagnosis being associated with less favorable ratings. This evidence contributes to a clinical understanding of differences between these two diagnosed mood disorders, differences with potential implications for intervention, especially with those diagnosed with bipolar disorder.

In other studies, the groups being compared using a cross-sectional research design might also represent different age groups. The conclusions drawn from such a study could be intended to help develop or test theory concerning the developmental course of a phenomenon or changes in it over time.
A cross-sectional study example explored the potential impact of young children having been exposed to intimate partner violence (Bowen, 2017). The investigator utilized one data point (when the children were four years old) to assess the presence of conduct disorder symptoms among children whose mothers reported their partner having been emotionally cruel and/or having physically hurt them during the child’s first 33 months. Among 7,743 children, the mothers of 18.4% of girls and 17% of boys reported experiencing a measured form of intimate partner violence during that developmental period. Conduct problems were significantly more common among these children compared to children whose mothers reported no exposure to intimate partner violence: 2.12 times more common among exposed boys and 2.85 times more common among exposed girls. The source of data for this study was longitudinal: one cohort of families participated in data collection at multiple time points during the course of the child’s development; however, the study results reported by Bowen (2017) were based on one time point alone, making it a cross-sectional study.
The cross-sectional study presents a single snapshot description of the group’s aggregated ratings. A longitudinal study design is more sensitive to fluctuations over time and to variation patterns experienced by individual couples, presenting a more video-like description. When the effect of time (or age) is of interest, conclusions from cross-sectional studies must be drawn with caution since many alternative explanations for any observed group differences exist, most of which have little to do with the passage of time or developmental changes. That is where longitudinal designs are more helpful.
Longitudinal Research Design. A longitudinal study involves data collection from the same participants at two or more points in time. The beauty of this approach is that it allows investigators to directly address questions involving change over time. Longitudinal studies are a common means of studying or evaluating social work interventions, for example. This design strategy is also common in studies about human developmental processes. For example, a longitudinal study design was used to study behavior and cognitive functioning in 189 young adolescents who had experienced prenatal cocaine exposure and 183 who had not (Minnes et al., 2016). Data were collected when these individuals were 12 years old, and again when they were aged 15. At age 12, girls with prenatal cocaine exposure had more problems regulating their behavior and with metacognition than did girls without prenatal cocaine exposure; there was no observed difference between the groups for boys. At this point, the study conclusions could have been derived from a cross-sectional study comparing the two groups at age 12 alone. However, the investigators also reported that both behavioral and metacognition problems improved from age 12 to 15 for the prenatally cocaine exposed girls at a greater rate than the other groups. While some differences did exist at age 15, it is important to note that the conclusions that might have been drawn from the cross-sectional element of the study (girls at age 12) are different from conclusions drawn from the longitudinal report comparing ages 12 and 15.
The group of individuals being followed in a longitudinal study are called a study cohort. In the above example, the cohort was a group of babies born 12 years before the analyzed data were first collected. This group continued to be followed at age 15. In addition to studying a birth cohort like this, investigators might study other than birth cohorts. For example, an incoming class of BSW students might be followed each semester until graduation from the program. Or, investigators might longitudinally follow a cohort of veterans and their families as they return from deployment at about the same time. Or, investigators might follow a group of survivors of a traumatic event such as the 9/11 collapse of the twin towers in New York City or the Washington, DC attack on the Pentagon. The concept of “cohort” indicates that the study participants share a common experience or event.
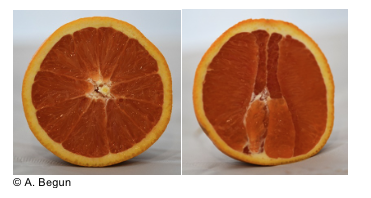
Comparing Cross-Sectional and Longitudinal Designs. These two study designs result in somewhat different perspectives even if the same phenomenon is being examined; much as an orange sliced across its equator looks different from one sliced from top to bottom.
Each design approach is associated with advantages and disadvantages that come under consideration by investigators as they plan their studies. Let’s take a closer look at what these considerations might include.
Individual variation. Longitudinal studies, compared to cross-sectional studies, are more sensitive to the unique, diverse patterns of behavior observed for individuals over time. In cross-sectional studies, individual differences are blended together for each group being compared. In longitudinal studies, behavior at one point in time is maintained within the context of behavior at prior and later points in time. This provides useful information about how individuals change.
Adaptability. One limitation of longitudinal studies is that investigators are “stuck” with continuing to use the same (or very similar) measurement approach throughout the life of a study. Measurement consistency ensures that differences at different time points are a function of time, rather than different measurement approaches. Unfortunately, the science of measurement may progress over the course of a longitudinal study so that by the end of the study, a better way to measure the variables of interest may have emerged. A cross-sectional study can capitalize on the best, latest measurement strategy available at the time the study is conducted. The longitudinal study must continue to use what was the best, latest measurement strategy at the start of the study, regardless of progress in measurement science that has occurred by the end of the study period.
Concurrent versus retrospective measurement.If investigators are addressing questions about change, data collected concurrently at each point in time may be more reliable than data collected at one point asking about previous points in time. This latter retrospective data may be contaminated by memory or other sources of bias, making inferences about change less accurate.
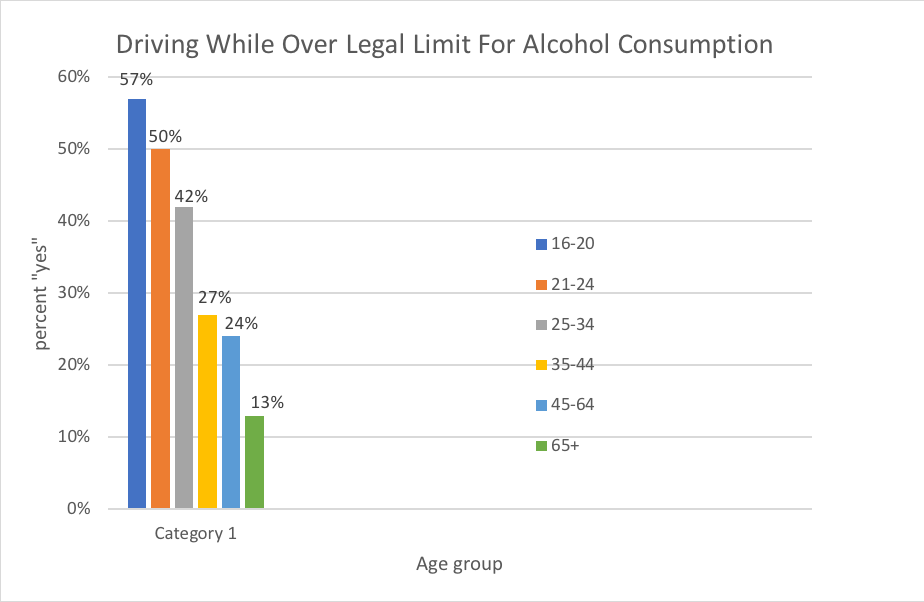
Time. Imagine that investigators wanted to know how driving after drinking excessive amount of alcohol might change as people age. A study conducted in 2008 demonstrated that the percent of persons who did so during the prior 12 months was highest among persons aged 16-20 years (57%), and declined with each subsequent age group to those aged 65 and older (see Figure 3-1). This cross-sectional study, covering an age span of more than 50 years was conducted in about four months. If the same question were to be studied longitudinally, following the 16-year-old participants until they were aged 65, and asking the question at intervals along the way, it would take every bit of those 50 years to complete. Sometimes longitudinal studies are simply impractical to undertake because of the time involved.
Figure 3-1. Percent driving during past 12 months when thought to be over the legal limit for alcohol consumption (N=1466 drivers who also consume alcohol, adapted from NHTSA, 2010).
Attrition. Investigators conducting cross-sectional studies, because they only involve one measurement point for each study participant, are not concerned with losing participants over time. Participant attrition (drop-out) from longitudinal studies is a very serious concern, and a great deal of effort needs to be directed toward retaining each participant longitudinally over time. Participants disappear for a number of reasons: losing interest in study participation, the condition or phenomenon being studied changes, moving out of the area, becoming incarcerated or otherwise being lost to study continuation/follow-up. Furthermore, there exists some degree of investigator turn-over/attrition possible, as well.
Cost. Longitudinal studies may be more costly than cross-sectional studies to implement because of the need to maintain participants’ involvement over time (retention).
Statistical analyses. Different types of analyses need to be conducted on data that are longitudinal compared to cross-sectional data. This is neither an advantage nor disadvantage, just a difference worthy of note.
Descriptive, Correlational, and Experimental Research
Back in Module 2, you were introduced to research questions of an exploratory, descriptive, or explanatory nature. Here we examine the traditions in quantitative research that help address these different types of research questions: descriptive, correlational, and experimental studies.
Descriptive Research. The aim of a descriptive research study is either to create a profile or typology of a population, or to describe a phenomenon or naturally occurring process (Grinnell & Unrau, 2014; Yegidis, Weinbach, & Meyers, 2018). Descriptive research contributes important information for understanding diverse populations, social work problems, and social phenomena. An example of descriptive research was a study aimed at identifying different substance use patterns among pregnant adolescents (Salas-Wright, Vaughn, & Ugalde, 2016). The study investigators started with an understanding from previous research that there exists an overall pattern of elevated substance use levels prior to conception compared to non-pregnant peers, and of reduced use during pregnancy. However, these investigators were concerned that this general, aggregate picture of pregnant adolescents might mask different patterns (heterogeneity) having important social work practice implications. The team analyzed substance use data for 810 pregnant adolescents, aged 12-17. They were able to discern and describe four different pattern types: abstaining from any substance use, using only alcohol, using both alcohol and cannabis, and polydrug use. Those who only drank alcohol prior to conception tended to cut back or eliminate drinking during pregnancy. Those who used alcohol and cannabis or engaged in polydrug use were fewer in number than those who only used alcohol, but also were less likely to stop using substances during pregnancy. Those who engaged in polydrug use were the youngest group and most likely to meet criteria for a substance use disorder. The different substance use types were not evenly distributed by demographics (ethnicity, age, family income) or pregnancy stage across study participants. The results of this descriptive study have social work and public health implications related to intervening in different ways with adolescents of different types to prevent or reduce prenatal exposure to substances.

Correlational Research. The aim in some studies is to evaluate the existence and nature ofrelationships that might exist between variables—looking to see if variable xand variable yare associated or correlated with each other. These are called correlational research studies. As mentioned in reference to descriptive studies, the investigator does not manipulate variables experimentally: naturally occurring relationships among variables is the focus of study. An interesting approach to understanding social work problems and social phenomena involves the use of geospatial data. You may have heard the term GIS—short for geographic information system—which is about data that have a geographical, spatial component. This type of data is useful for social workers to understand how a problem or phenomenon might be experienced in the environmental contexts where people live, work, recreate, or otherwise function.
A correlational study using geospatial data examined relationships between use of and physical access to marijuana with child maltreatment (Freisthler, Gruenewald, & Price Wolf, 2015). First, the investigators demonstrated that parental use of marijuana was positively correlated with the frequency of child physical abuse, negatively correlated with physical neglect, and not correlated with supervisory neglect. Parents reporting marijuana use reported engaging in physical abuse three times more frequently than parents who did not use marijuana, with boys more likely than girls to be physically abused, and older children more likely to be physically abused than younger children. The data for these results came from telephone interviews with 3,023 persons in a state with “legalized” medical marijuana dispensaries and delivery services. The geospatial data came into play in analyses indicating that greater geographical density of medical marijuana dispensaries and delivery services was positively related to greater frequency of physical child abuse. These findings have important implications for social work practice and social policy, including that marijuana use may be problematic even if a marijuana use disorder is not diagnosed in the child welfare context, and that there may exist differences in the impact of marijuana use in communities where distribution is legitimized, relegated to illicit “street-level dealers,” or not present.

Correlation versus Causality. The major limitation of correlational research is that the tradition is unable to definitively determine causality in observed relationships between variables of interest. When a correlation is observed between two variables, xandy, at least four possibilities exist:
- x influences y
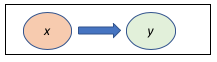
- y influences x
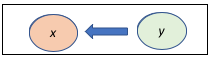
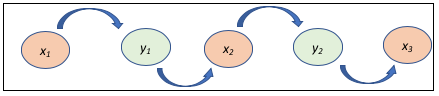
- x and y influence each other in a more complex, circular, iterative manner, where x influences y which influences x which influences y and so forth
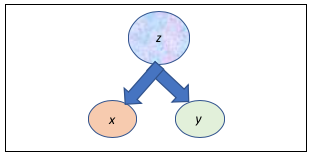
- some third variable, z, causes both x and y but these two do not directly influence each other
To logically draw conclusions about causality, at least three conditions need to be met.
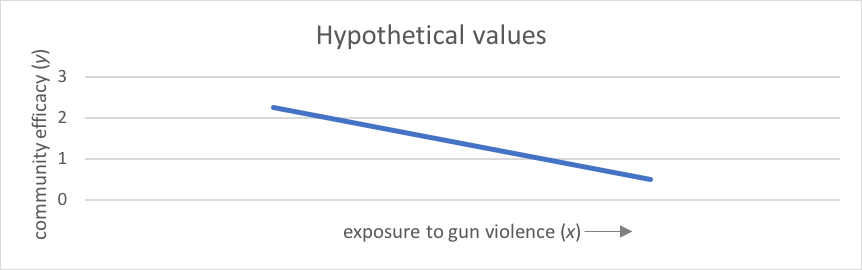
1. Evidence exists that the two variables are related—as values for the “cause” change, values for the “effect” also change systematically in relation to those changes in the “cause.” This is what the correlation statistic can demonstrate: changes in xrelate to changes in y. In addition, that the two are related must be consistently demonstrated—that changing the “cause” consistently (not arbitrarily) results in “effect” changes (Cozby, 2007). Consider the example presented earlier about exposure to gun violence and perception of community efficacy (Riley et al., 2017). The investigators observed that as ratings of exposure to gun violence increased (the xor hypothesized “cause” variable), ratings of perceived collective efficacy decreased (the y or hypothesized “effect” variable). This kind of relationship between the variables is called a negative or inverse correlation—as one goes up the other goes down. Depending on the actual values of the relationship, it might look something like Figure 3-2 where more exposure to gun violence (moving from left to right) is associated with lower community efficacy.
Figure 3-2. Depiction of negative (inverse) correlation using hypothetical values
2. The “cause” and “effect” must be sequenced in time, with the “cause” preceding (coming before) the “effect.”For example, consider the earlier-mentioned Bowen (2017) study concerning conduct disorder among four-year-old children who have been exposed to a mother’s experience of intimate partner violence. Before concluding that the exposure caused the conduct disorder symptoms, it is important to demonstrate that the children’s conduct disorder symptoms did not predate the exposure to intimate partner violence. If the conduct disorder came first, it is quite possible that the stress of managing a child with these behaviors influenced the intimate partner violence (y caused x) instead.
3. There is not another, third factor that “causes” both other factors. A demonstrative example comes from a purposefully absurd graph attributed on the internet to Bobby Henderson, used to demonstrate that correlation does not imply causation. The erroneous conclusion drawn from the data is that global warming (y variable) is a direct effect of the shrinking number of pirates (variable x). As you can see from Figure 3-3, between the years 1860 and 2000 the number of Caribbean pirates declined from 45,000 to 17, and in the same period, the average global temperature climbed from 14.25 degrees Celsius to 16 degrees Celsius (“data” retrieved from https://en.wikipedia.org/wiki/Flying_Spaghetti_Monster).
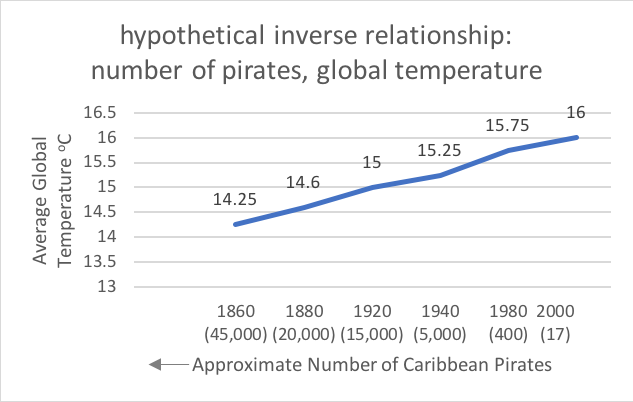
While the “data” indicate an inverse association between the two variables (notice that the approximate number of pirates is declining as year is increasing on the x axis), it is absurd to conclude that the reduction in pirate numbers caused global warming. A third variable might be causing both: for example, the mechanism of change in both might be related to the global spread of industrialization.
In summary, correlational research studies allow investigators to identify possible associations between factors, helping to develop better understanding about diverse populations, social work problems, and social phenomena. However, additional research is necessary to determine if there are causal relationships involved. This is important if we are to use evidence to inform the interventions we develop and test. If we do not understand the causal nature of the relationships and the mechanisms by which observed effects are caused, then we cannot determine the best places and ways to intervene. This understanding is enhanced through experimental research.
Experimental Research
The aim of experimental research is to answer explanatory questions: to test hypotheses or theory about phenomena and processes. This includes testing theory and social work interventions. Our next course, SWK 3402, emphasizes research and evaluation to understand interventions. Here we focus on experimental research to understand diverse populations, social work problems, and social phenomena. Experiments are designed to help develop our understanding of causal relationships between factors, the etiology of social work problems and social phenomena, and the mechanisms by which change might occur. Investigators develop and discover this kind of information through systematic manipulation of specific factors and observing the impact of those manipulations on the outcomes of interest. The study designs and methods applied in experimental research are selected to eliminate as many alternative explanations for the results as possible, thereby increasing confidence that the tested mechanism or explanation is accurately accepted: “Explanatory research depends on our ability to rule out other explanations for our findings” (Engel & Schutt, 2013, p. 19). This observation leads naturally to a discussion of internal validity and external validity in experimental research.
Internal Validity. The concept of internal validity refers to the degree of confidence that can be applied to the results of an experimental study. Remember, the purpose of an experiment is to develop an understanding of causal relationships between variables—in other words, to test explanatory hypotheses. Strong internal validity means greater confidence in drawing causal or explanatory conclusions from the data; this is sometimes referred to as study integrity. Experimental design is sometimes referred to as “the gold standard” against which all others are compared. This, however, would only be true if the aim of those being compared is explanatory—many other designs are important, depending on the nature of the research questions and aims. If, however, the aim is explanatory, designing a study that allows for investigator control over the greatest number of possible explanatory factors, ruling out alternative explanations for the observed experimental results, is most desirable—it means the study has strong internal validity.
External Validity. External validity is about the degree to which a study’s findings can be generalized to the population represented by that sample. External validity is again about confidence in the results, but this time it is about how well the results from a particular study represent a general reality for other similar people and other similar settings. For example, on attitudes about social issues, studies conducted with college student samples from private universities may poorly represent the nation’s population of college-aged adults, or even the population of the nation’s college students. Similarly, studies about a social work problem conducted with people in treatment or receiving services might not be representative of people experiencing the same problem but who are not in treatment and may never have sought treatment for the problem. This is called the clinical sample problem related to external validity concerns. As you will see in Chapter 6, external validity is powerfully influenced by the procedures involved in developing and retaining a study sample, including (but not limited to) problems of small sample size.
The Monitoring the Future study represent an example of strong cross-sectional survey methodology, contributing to the study’s high external validity. The Monitoring the Future study has been conducted with 12thgrade students every year since 1975, and with 8th, 10th, and 12thgraders since 1991—you may very well have participated in the study at some point in your life. Some young adults are being surveyed in more recent years, as well. The purpose is to study trends in U.S. adolescents’ beliefs, attitudes, and behavior. To enhance generalizability of the annual findings, about 50,000 students are surveyed each year. These students are from about 420 public and private high schools across the nation, and include about 18,000 8thgraders from about 150 schools, about 17,000 10thgraders, and about 16,000 12thgraders from about 133 schools. A randomly selected subset of participants has been followed longitudinally every two years since 12thgrade, as well. The geographic regions are randomly selected each year, with random selection of the schools in the selected areas, and random selection of the classes to be included within each school. Random selection is a strong external validity contributor. You may be interested to see some of the trend results reported by the study investigators, located at http://www.monitoringthefuture.org/.
![]()
If you have enjoyed television shows like Bill Nye the Science Guyand Mythbusters, then you have witnessed systematic experiments being implemented. Their demonstrations typically include elements of scientific process designed to enhance rigor of the experiments under way. A great deal of social science, behavioral science, and social work research follows scientific methods and logic developed in physical and natural sciences. You might wonder why all social work research is not conducted under these scientific, experimental procedures. The simple answer is that a great deal of social work research is designed to address other types of questions: experimental research is designed to answer explanatory questions, not the other types that we have discussed.

A more complex answer includes that many possible experiments cannot be practically or ethically conducted. For example, we cannot ethically expose people to conditions that might cause them harm. To understand the impact of disrupted parent-child attachment bonds we cannot experimentally manipulate this condition to see what happens; instead, we need to rely on observing the effects through what happened “naturally,” such as when policy led to children and immigrant/refugee parents being separated at U.S. borders while parents were detained for having entered the country illegally. Similarly, we could not ethically conduct controlled experiments where children are randomly assigned to being raised by parents either with or without substance misuse problems, where families are randomly assigned to living in homes with or without lead contamination, or where communities are randomly assigned to having or not having access to affordable, healthy food. Abuse and ethical violations in experiments conducted with unknowing, under-informed, unempowered, and otherwise vulnerable persons led to the development of policies, guidelines, and practices discussed in your CITI training about research involving human subjects—including the Belmont Report and Institutional Review Boards.

Take a moment to complete the following activity.
Chapter Summary
This chapter introduced the traditions of quantitative research. You read about the distinctions, advantages, and disadvantages of cross-sectional and longitudinal study designs. You also read about descriptive, correlational, and experimental studies, and were reminded that correlation does not imply causation. Finally, the topics of internal and external validity were examined. The next chapter further develops a foundation for understanding the wide range of available options and decisions to be made by investigators planning experimental research. The focus includes understanding the nature of variables involved in quantitative studies, whether they are descriptive, exploratory, or experimental in nature.
