Module 5 Chapter 4: Creating Infographics
Unlike the research manuscript, professional report, or presentation, an infographic presents data and implications in a brief but impactful format. The challenge involves making complex information easily understood by diverse audiences. Infographics can be incorporated into presentations, but are often free-standing tools. As the producers of the venngage blog suggest, “they also make dry information more engaging” (https://venngage.com/blog/create-infographics). As social work professionals, you may elect to present empirical evidence in this format, depending on the audience and purpose of the communication effort. In this chapter you will learn:
- What infographics are and when they might be useful;
- Steps in creating an effective infographic;
- Tool for developing infographics;
Infographics Described
An infographic is a brief informational graphic tool (usually 1 page or computer screen shot). According to the venngage blog introduction to infographics:
They are often used to visualize data, step-by-step processes, timelines, research findings, organizational hierarchies, and many other types of information (https://venngage.com/blog/create-infographics).
Infographics tend to be more engaging to audiences than lengthy text—like reading a book with pictures often is more interesting than reading a book with only words. Imagine reading Hawthorne’s The Scarlet Letteras a high school student with pictures to make the characters and their situations come alive for you, compared to reading the text alone. This helps explain the popularity of graphic novels.
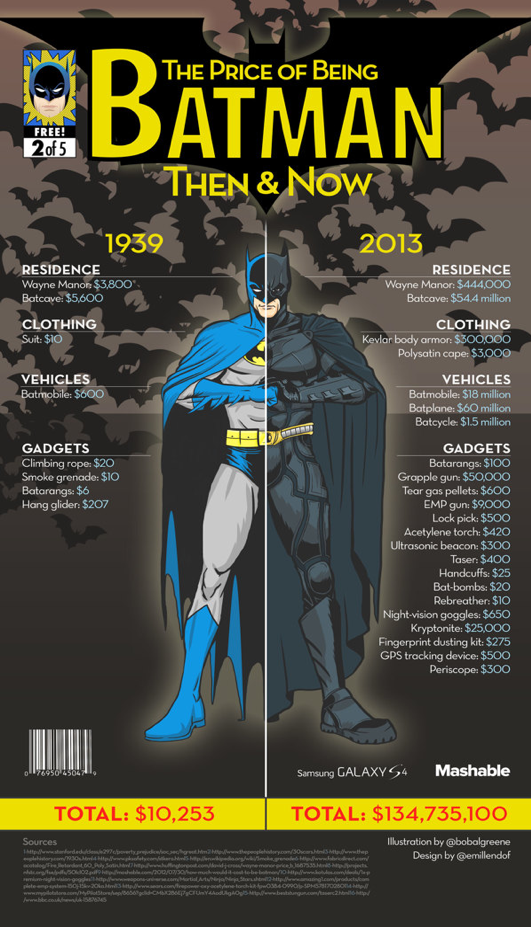
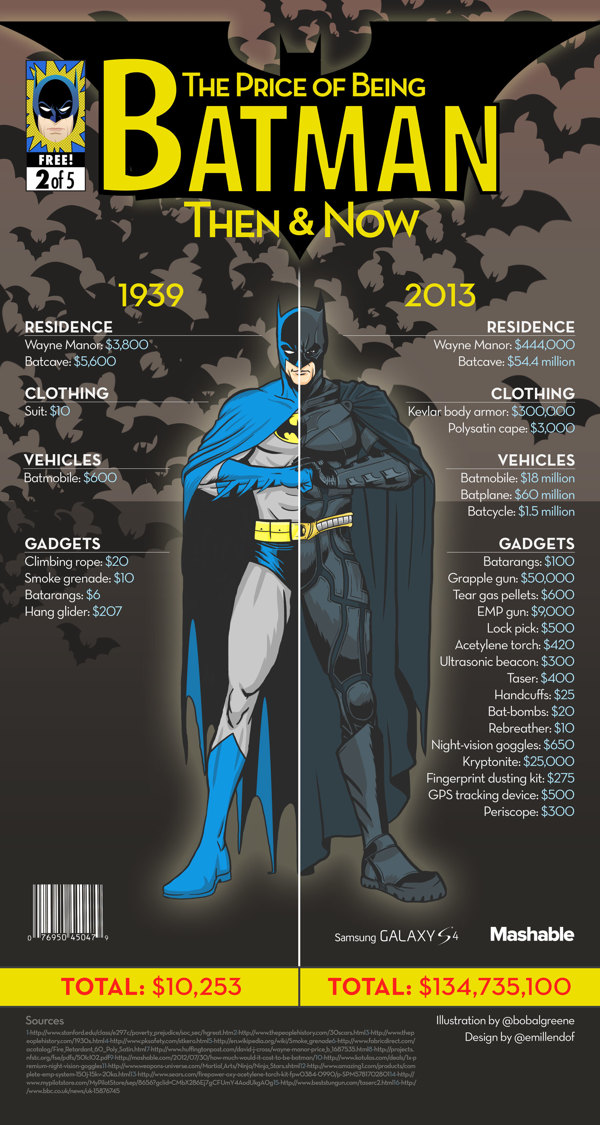
Infographics tap into a fact long recognized in psychology: images are more easily interpreted and recalled than the written word (Paivio, 1971). For example, thenextweb blog presented the example below where you can quickly see how costs (of being a superhero) exploded between 1939 and 2013. Imagine if you had to read through this information in text form?
https://thenextweb.com/wp-content/blogs.dir/1/files/2013/10/batman-then-and-now.jpg
Steps in Creating an Infographic
The following presents 4 steps in creating an infographic for communicating with your audiences.
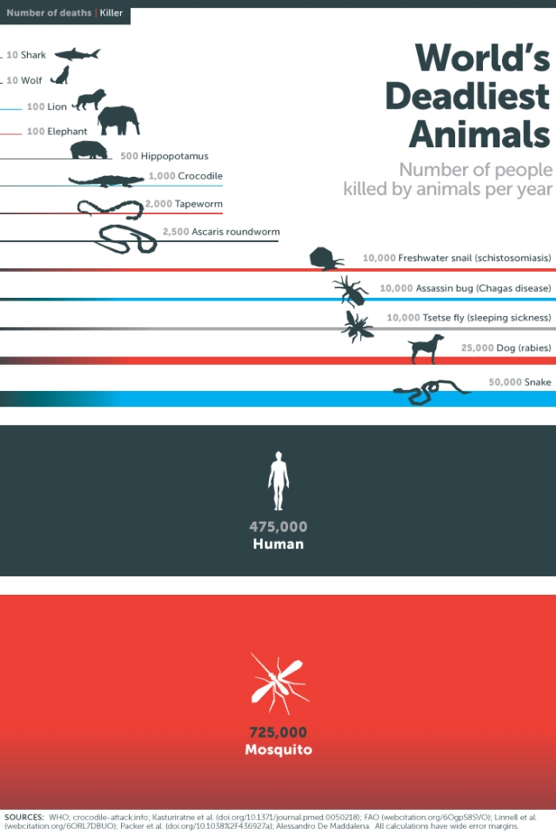
Step 1. Translate your topic into a burning question that interests your audience. As an example, venngage blog (https://venngage.com/blog/create-infographics) highlights the use of an infographic by the Bill and Melinda Gates Foundation to generate interest in a topic of little interest to many people in Northern climates: malaria. They framed it in terms of the world’s deadliest animals—if you are a fan of “shark week,” have a fear of crocodiles, snakes, spiders, or creatures, or are concerned about interpersonal violence rates, this infographic might peak your interest.
Step 2. Gather the information to be presented in the infographic. Most likely, you will collect more information than is needed. You will need to be selective and/or creative in how you combine different pieces of information. However, it is also critically important that you maintain truthfulness in your selection and presentation of information. You also need to cite your sources!
Step 3. Design the infographic. One feature to keep in mind as you design an infographic is the medium through which it will be distributed. If it will be presented in print, you may have the luxury of using both sides of a page; if a poster or electronic “screen” is the medium, you are limited to one side/one page. Various software packages are available, many for free, to help in the design process (e.g., Canva Infographic Maker; Easel.ly; Piktochart; Snappa; Venngage; Visme; Visualize). Most of these are free to use in their “base” form; advanced options are available with a fee. Another option is to design the tool “from scratch” using either Word® or PowerPoint® with or without design templates. Remember to be concise, precise, and accurate in what you write. Consider image and graph/chart tools previously discussed, as well.
Step 4. Produce the infographic in your selected medium (print, electronically, or both) and disseminate your information to your audience.

Spend some time in a “scavenger hunt” viewing and critiquing infographics that others have developed. Consider what seems to work and what does not for the different examples you locate. Use your observations to generate a set of guidelines for developing your own infographics (e.g., layout, color, design, content, writing style).
Chapter Summary
Infographics as a powerful communication tool were introduced. You learned a bit about why they are effective means of communicating with diverse audiences, and you learned 4 steps in their production. In addition, several free tools were identified for assisting in their design.
