Module 3 Chapter 5: Overview of Methods for Data Collection and Measurement
Remember that one defining characteristic of scientific inquiry is that it involves observation. This chapter is concerned with the many different approaches to observation that are commonly utilized in social, behavioral, and social work research. Each has its advantages and disadvantages, and investigators are faced with significant challenges in planning the measurement/observation aspects of their studies. In this chapter you will read about:
- validity and reliability principles related to quantitative measurement
- qualitative and quantitative measurement and data collection approaches
Measurement Validity & Reliability in Quantitative Research
The point of quantitative measurement is to objectively measure characteristics, features, or variables of interest. While this may seem obvious, it is important not to confuse variables and measures—measurement tools provide information about variables, they are not variables themselves. This measurement topic is focused on quantitative studies because it is not relevant to the aims of qualitative research. Two measurement traits are important in achieving the quantitative measurement task: measurement validity and measurement reliability. While neither trait can be realized 100%, the aim is to maximize both to the greatest extent possible. Let’s look more closely at each of these traits and what they mean in quantitative research.
Measurement Validity. Measurement validity is about the extent to which a measurement tool or instrument adequately measures the concept, construct, or variable of interest (Perron & Gillespie, 2015). In other words, does it really measure what it purports to be measuring (Grinnell & Unrau, 2014). It may help to note that this use of the term “validity” is getting at a very different point than did the terms internal and external validity that your read about earlier in terms of experimental study designs. There we were concerned with either how confident we were in the results of the study (internal validity) or the conclusions of the study being generalizable (external validity). Here, we are concerned with the measurement procedures employed in generating those results. Measurement validity plays a role in both internal validity and external validity of a study, but operates at a more specific level of the research process.
Our general definition of measurement validity includes aspects or components that you might read about: construct, content, and face validity, for example. While these are not all the same thing, they all contribute to a general assessment of measurement validity. Validity is sometimes assessed by convergent validity analysis, as well. In convergent validity, measurement scores or values are compared with those obtained on other measures of the same construct or variable, measured at the same time. For example, the URICA (University of Rhode Island Change Assessment) is a 32-item tool used by practitioners to assess clients’ motivational readiness to change (McConnaughy, Prochaska, & Velicer, 1983). If investigators or clinicians desired a shorter, briefer version or a version for self-administered use on mobile devices, they would first need to demonstrate that the new version or format led to the same results as the original form.
Additionally, it is important that investigators recognize limitations of instruments and measures for work with different target populations. For example, the need to know how validly an instrument or measure translates into other languages. The problem with direct translation into another language is that nuances relevant to different cultures may play a role in how the measure is experienced. For example, translating an instrument developed in English into an instrument for Spanish-speaking persons is not simply a matter of using an English-Spanish dictionary and substituting words. There are many differences between the Spanish spoken and used in daily life among persons from Spain, Mexico, Chile, Cuba, and other areas, and there are many colloquialisms and slang terms that do not translate word-for-word. For example, the word “dope” has many meanings even in English: someone who does something stupid, marijuana or heroin (depending on region and cohort), insider information, or something that is awesome. A recommended practice is to have a native speaker of the language conduct a translation, then have another native speaker reverse translate it back into English and compare the original to the double-translated version to see where meaning was altered or lost.

Furthermore, it is important to be aware that language interpretation is not the same thing as cultural interpretation. In other words, just because the words are literally translated correctly does not mean that they have the same cultural meaning across cultures. Careful attention must be directed toward creating or selecting culturally relevant or culturally grounded approaches to measurement, instruments and measures that accurately capture the lived experiences of the studied population.
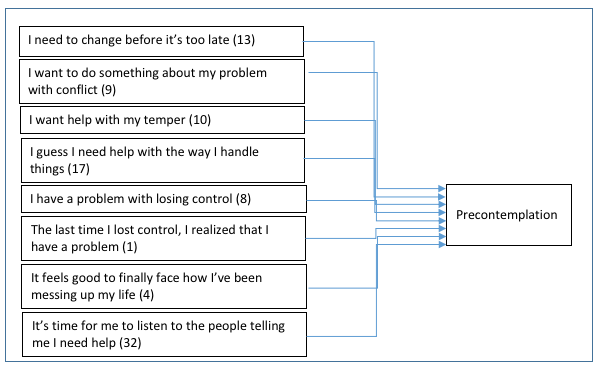
Latent variables. One important difference between the physical and natural sciences compared to social, behavioral, and social work science is related to whether the phenomena of interest are directly or only indirectly observable. Much of the science directed towards understanding diverse populations, social work problems, and social phenomena involves studying internal mental processes, attitudes, beliefs, and interpretations.A variable that is not directly observed but is mathematically or statistically inferred from other variables that are directly measuredis called a latent variable. For example, in creating the Safe At Home instrument for measuring readiness to change battering behavior (Begun et al., 2003; 2008), investigators inferred the variables for Precontemplation, Contemplation, and Preparation/Action from the study participants’ ratings of their agreement with 35 readiness statements. They created these 3 latent variables through a statistical approach called exploratory factor analysis (EFA)—see Figure 5-1. Validity of these sorts of inferred variables is an important issue to consider, and evaluating a research study may involve evaluating the evolution of inferred, latent variables that may have been used.
Figure 5-1. Items loaded in Contemplation (latent variable) through EFA (constructed from results presented in Begun et al., 2003)
Proxy variables. A commonly encountered validity issue arises with the use of proxy variables. The word proxy means something (or someone) is representing something (or someone) else. A proxy voter is authorized to vote on behalf of someone else. A proxy variable is a variable that stands for or represents something else. A proxy variable is not directly relevant in itself, but serves as a close approximation of the variable of interest. Proxy variables are used when the variable of interest is difficult (or impossible) to measure; they are easily measured variables that can be used in place of more difficult-to-measure variables.
For example, birth order can be either a variable of interest used on social research, or it can act as a proxy variable for something more difficult to measure, such as parental attention or parenting experience. When we see a correlation between birth order and a trait (like intelligence or personality), we do not necessarily understand that relationship. Could it be the result of a biological phenomenon related to health of the prenatal, uterine environment which may change with each subsequent birth? Or, is it a function of how much time, undivided attention, and social/intellectual attention each subsequent child receives from parents? This is the problem with proxy variables—we do not know how validly they fit the actual construct for which they are standing in. Factors other than actual birth order number (1st, 2nd, 3rd and so forth) are associated with how much parental time, attention, and stimulation is received, making birth order a less than ideal proxy variable for the hypothesized mechanism of effect on child intelligence. Investigators generally do better to find direct measures of the constructs in which they are interested than to rely on proxy variables. Individuals reviewing a research report need to critically analyze the degree to which they believe a proxy variable is a good representative for the variable of interest. By the way, you may be interested to learn the results of a large-scale study about birth order (Rohrer, Egloff, & Schmukle, 2015): the authors concluded that “birth order does not have a lasting effect on broad personality traits outside of the intellectual domain” (p. 14224).

Also consider the problem of using age or income as a proxy variable for something else. For example, age is a relatively unreliable proxy for physical condition or health. Consider research that indicates 20% or more of U.S. children and adolescents have abnormally high cholesterol levels, a condition associated with poor cardiovascular health among adults (Nguyen, Kit, & Carroll, 2015). Or, consider older adults whose condition is similar to average adults in much younger age groups—marathons have age groupings of 70 and over or 80 and over—while many younger adults could not meet the physical challenges involved. Age is not a great proxy for fitness. Similarly, income might not be a good proxy for families consuming nutritious food. Some persons reside in “food deserts” where nutritious food is difficult to obtain within a reasonable geographic distance regardless of their available economic resources. Income is not entirely predictive of this experience since some families with low incomes are able to grow much of their own healthful food, while others cannot, and some families with higher incomes spend their resources on poor quality “fast” or “junk” foods instead of healthful foods.

Proxy variables are risky to apply to populations where there exists a great deal of heterogeneity. Unfortunately, investigators are sometimes forced to rely on proxy variables when measuring the true variable of interest is not possible. This problem is often encountered when working with administrative or secondary data.
Measurement Reliability. As a complement to measurement validity, measurement reliability indicates the degree of accuracy or precision in measuring the construct or variable of interest. This accuracy indicator is concerned with stability in measurement, for one thing: if you use the tool or instrument to measure the same thing multiple times, you would hope to get the same result. Imagine trying to measure your cereal box with a rubber band—you want to know how many stretched rubber bands big it is. If you measured it 5 times in a row, the chances are that you would not get the same answer all 5 times because the rubber band is such a flexible tool and you cannot be sure you applied the same amount of pressure each time .
Reliability problems arise in real-world research, as well. Imagine, for example, that your goal was to measure aggressive behaviors exhibited by a toddler. It might be easy to count kicking, biting, shoving, and hitting behaviors. But how would you count instances where the toddler yells or spits at someone, raises a hand to strike but doesn’t follow through, or kicks the person’s chair rather than the person? Would everyone observing that behavior reliably count it the same way? This gets at the issue of precision. An important dimension of measurement reliability is called inter-observer reliability. This might also be called inter-rater or inter-coder reliability, depending on the nature of the measurement data. In studies where qualitative, open-ended questions, or observational data are being evaluated for analysis, strong research methodology involves applying methods to assess and ensure that different observers, raters, or coders would get the same result when evaluating the same data. For example, the team might spend time up front training a group of observers to rate or code a set of sample data. Once everyone has developed a strong consensus on the practice data (at least 90% agreement is one standard), pairs of observers might rate or code a percentage of the actual data, with their evaluations being compared. Again, the expectation is that their level of agreement is very high, and that it remains high over time (not just when the training was still fresh in their minds).
There exists a tremendous need to ensure reliability in measurement, particularly in social work research where variables might be difficult to directly observe and quantify. For example, social work practitioners and researchers might be concerned with reliably measuring anxiety. Asking different individuals to rate how anxious they feel right now on a scale of 0-10 might not generate very reliable answers. While zero might be clear to everyone (no anxiety at all), for a person who often experiences very high levels of anxiety, a “5” might mean something very different than for a person who seldom experiences anxiety or whose anxiety is mild when experienced.
The goal with measurement reliability is to minimize measurement error. Measurement error is a recognized problem in social work, social science, and behavioral science research. It concerns the difference between value obtained through measurement of a variable and the variable’s true (unknown) value. Investigators do their best to be accurate in measurement, but a certain amount of “noise” is always a concern in the data collected. Measurement error leads investigators to either over- or under- estimate reality. Turning back to our anxiety measurement example, measurement error or bias may be introduced by the context in which anxiety is measured. Measuring immediately before or after a quiz might lead to different results than measuring first thing in the morning after a good night’s sleep. Or, women being interviewed about experiences of sexual harassment might respond differently to male versus female interviewers. Or, data collected on Mondays might be either more accurate after participants have had a restful weekend or might be less accurate after their partying weekends, compared to data collected on other days of the week.
Cultural Competence. An issue integral to both measurement validity and reliability concerns cultural competence in measurement procedures. You may be familiar with the long-standing controversy concerning cultural bias in standardized testing, particularly intelligence tests. A demonstrative example comes from an intelligence test purportedly administered to Koko, the gorilla who learned to communicate with humans using American Sign Language. When asked where you should go if it starts to rain, Koko “failed” the item by responding “up a tree” instead of “inside a house.” The test is clearly “human-centric” and biased against gorillas. Similarly, there are many examples of ethnic, cultural, geographic, gender, and other bias built into testing materials. For example, the T-ACE (Tolerance, Annoyance, Cut Down, and Eye Opener) and TWEAK (Tolerance, Worry, Eyeopener, Amnesia, Kut Down) are two alcohol screening tests developed for use with women when it was determined that existing screening measures were more appropriate for use only with men (Russell, 1994).
Cultural equivalence/nonequivalence and avoiding ethnocentrism are important consideration when evaluating or planning measurement in quantitative research. The issue is that concepts or constructs may have very different meaning to persons living in different cultural contexts. Consider, for example, the meaning of marriage to individuals in same- versus different-sex relationships, particularly in light of the unstable history of marriage policy across the nation and the globe. Also consider that equivalents for a phenomenon that exists in one cultural group may not exist in another. An example might be the sibling-like cousin relationships that exist among cultural groups characterized by high degrees of cooperation and community compared to the nuclear family conception of siblings.
One type of research question concerns measurement science: validating research measurement and clinical assessment tools for use with diverse populations. This may begin with the initial development of a measurement approach/instrument, or involve recommended modifications of existing tools based on evidence. An important “how to” resource is a book called Developing cross-cultural measures in social work research and evaluation, 2ndedition (Tran, Nguyen, & Chan, 2016).
A concern beyond the actual measurement tools is the measurement procedures involved in a study. Of great concern is the way that the measurement process might put study participants in jeopardy. One example is measurement that asks about illegal behaviors, such as underage drinking, illicit use of drugs at any age, or substance use during pregnancy. Asking for honest, truthful answers to these kinds of questions can place participants in jeopardy with legal or child welfare systems if the confidentiality is breached. One tool for managing this risk is the Certificate of Confidentiality that an investigator might request from the National Institutes of Health (NIH) in connection with securing local IRB approval to conduct this type of research. The Certificate of Confidentiality is designed to protect investigators from being forced by court order to disclose individually identifiable data.
Another scenario to consider is discussed in an article about safety in research involving unauthorized immigrant women experiencing intimate partner violence:
“Social science research with vulnerable populations is necessary in order to address social and health problems among those most in need. Yet, this research is fraught with inherent risks to its participants” (Kyriakakis, Waller, Kagotho, & Edmond, 2015, p. 260).
The authors expressed concern over the potential physical, emotional, psychological, economic, and legal harms to which these women could be exposed by virtue of the research process. The risk to the 29 Mexican immigrant women was related to their recent history of exposure to intimate partner violence, and for 26 of the women the risk was compounded by their unauthorized immigrant status. The authors described various strategies used to minimize the women’s risks of participation, including cautious recruitment, screening, informed consent, interviewing, data management/storage, resource referral, and data reporting procedures.

Ways of Measuring and Collecting Data
Whether a scientific study adopts a qualitative or quantitative approach, investigators need to determine a strategy for collecting data about the phenomenon being observed. Options vary along several dimensions, one of which is the degree to which strategies are obtrusive. Think about your family’s home videos and the pictures you have on your phone. There is a great deal of difference between the candid and posed images—the candid images capture more natural behavior than do the posed images.
The same is true of scientific measurement: behavior observed under natural conditions is more representative than is behavior observed under laboratory conditions or conditions where those being observed are aware that their behavior is being studied. This is the first dimension we explore with regards to ways of measuring and collecting data.
Naturalistic Observation. Both qualitative and quantitative studies can utilize naturalistic observation techniques in data collection. This means that information about behavior is collected in normally experienced contexts. If an investigator wishes to learn about aggression between preschool-aged children, the behavior might be observed in naturally occurring situations and natural environments—daycare, playgrounds, at home, or riding in the car. The advantage of this approach is that the data are representative of natural behavior. The disadvantages of this approach include lack of investigator control over circumstances or variables that might interfere with the behavior being observed. For example, home observations might be interrupted by the doorbell or telephone ringing and the dog barking, which might alter the behavior of those being observed. Laboratory conditions can minimize these confounding factors, but observations of behavior expressed in the laboratory may not accurately reflect or generalize to natural behavior conditions. Another factor which investigators take into account is the possibility that the behavior of interest might not occur often enough to actually be observed under natural conditions. Investigators may feel the need to create laboratory conditions to “trigger” the behavior of interest so that it can be observed. For example, imagine that investigators are interested in observing how families negotiate the distribution of resources across members and for the family as a whole. This may be difficult to observe during a conveniently scheduled period of observation. The investigators might, instead, provide the family members with a specific distribution task and observe how they negotiate a solution—perhaps providing them with a scratch-off State lottery ticket and asking them to decide what to do if were a $1,000 winner. While this is not a typical, routine resource distribution problem that families encounter, the task is designed to “trigger” resource distribution behavior from the family members being observed. The limitation being that family members will need to advise the investigators as to how typical their behavior was compared to naturally occurring situations.

The type of data collected from naturalistic observation differs between qualitative and quantitative studies. Qualitative data might include rich, detailed descriptions of who does/says what, when they do/say it, how they do/say it, and the sequential context of what happens–the precursors and consequences of each behavior. These data may later be coded for themes or other qualitative analyses. Quantitative data might include numeric counts of the frequency of certain behaviors or the duration (in seconds or minutes) of specific behaviors of interest. To accomplish this, the investigators need to have predetermined what behaviors will be recorded as data, being very precise as to the definition and criteria for those behaviors. In both cases, qualitative and quantitative, the ability to review the action is helpful to ensure data accuracy and completeness. Thus, recording the observed events is common so that the events can repeatedly be replayed. Furthermore, working with recordings allows investigators to cross-check data decisions made by individuals coding, scoring, or rating the observed behaviors.
Direct observational data is particularly useful in studies where participants are not able to provide information about themselves or their usual behavior. This is generally true of infants and young children, for example. As their language/communication skills develop and mature, individuals’ ability to answer questions about their internal thought processes and behavior improves, at least somewhat. Observation may be a strong option in studying persons who have cognitive or intellectual barriers to consistently providing information—persons with dementia, for example.
Photovoice. An approach to qualitative data collection that differs from observing individuals in their natural environments involves having individuals themselves actively engage in observing their natural environments. Photovoice is a powerful participatory action strategy for data collection (Wang, 1999). The approach begins with having individuals take photographs of what is meaningful to them in their daily lives. It is particularly important as a method used with traditionally marginalized groups or communities (Fisher-Borne & Brown, 2018). The second phase of photovoice methodology is equally, if not more, important—recording the participants’ explanations of the images they chose to capture or create. The use of photovoice methodology was presented as a strategy for engaging young, Black men as researchers in community-based participatory research (CBPR) with the goal of shaping an HIV prevention and care project, ensuring that they are empowered to engage and have their voices heard (Fisher-Borne & Brown, 2018). In this study, participants documented engaged in action-oriented, problem-solving group discussion sessions about their photos. This feature distinguished the study from documentary photovoice projects—the emphasis of the discussions was on helping the men identify issues and action steps toward personal and societal change. Each week of the project had a theme around which the men took pictures (e.g., stereotypes, Black masculinity, sexuality, self-esteem, emotions, multiple “identities”). The pictures were discussed in group sessions, with each photographer selecting their own discussion photo, providing a name or label for it, and leading discussion about it in relation to the theme. The analyses which included the study participants resulted in 4 themes: identity, stereotypes reinforce oppression, expectations, and breaking free/embracing self. The authors argued in favor of using this approach as a qualitative, action-oriented research method:
“Embedded within the Photovoice technique is the belief that people can participate and define for themselves issues that will shape their lives. While Photovoice is a vehicle for personal expression, its structure provides for the vocalization of community and public issues. As such, the visual images and participatory process serve as a tool for advocacy and collective action” (Fisher-Borne & Brown, 2018, p. 171).

Artifact Analysis. Another form of unobtrusive observation involves analyzing the remains or artifacts that remain after naturally occurring behavior. For example, alcohol researchers may wish to record data concerning the alcohol purchases made by study participants. Participants could be asked to save all receipts (paper and electronic) for all purchases made in a month. These receipts can then be content analyzed for purchases involving alcohol. This artifact analysis approach may be more representative of actual alcohol purchasing behavior than asking about the behavior—individuals may be unaware of or mistaken about their actual purchasing behavior, either under- or over-estimating reality. Other types of artifacts that might be analyzed include personal diaries and social media postings, as well as data recordings from devices such as fitness and GPS trackers. As in the case of Photovoice methodology, other arts-based approaches might be appropriate: eliciting and analyzing dance, poetry, drawings/painting, sculpture, and other artifacts.

Administrative and Secondary Data Sources. Client records and administrative data are forms of artifacts that might usefully be analyzed to answer some research questions, as well. The information may not have originally been collected for research purposes, but may be informative in research all the same. Administrative data includes information routinely recorded in programs, agencies, and institutions as part of normal operations. For example, investigators analyzed data routinely collected at the state level as child abuse and neglect (CA/N) reports (Lanier at al., 2014). The investigators calculated disproportionality ratios for each state by comparing the state’s child maltreatment rate for black and white groups, and for Hispanic and white groups. They then related these state-by-state data to statistics about each state’s poverty, teenaged mother, and single mother rates. The results of this study using administrative data indicated that disproportionality in child maltreatment rates was correlated with disproportionality in poverty rates, and this was observed for both black and Hispanic groups. Furthermore, a significant amount of the child neglect disproportionality between black and white groups (66%) was accounted for by disproportionality in teen motherhood rates. This kind of study and the observed disproportionate poverty-maltreatment links have profound social justice implications for social work practice and policy.
Administrative data differs from what you may have heard called secondary data analysis. Secondary analysis concerns information collected for a research purpose, but analyzed differently than in the primary study for which the information was originally collected. The original study involved primary data collection, the later study involves secondary data analysis. For example, numerous investigators have secondarily analyzed data from the original Fragile Families and Child Wellbeing study. The original is an ongoing, multi-year, longitudinal study of child development outcomes in relation to numerous parent, family, and neighborhood factors. Barnhart and Maguire-Jack (2016) reported on their analyses concerning the role of parenting stress and depression in the relationship between single mothers’ perception of community social cohesion and child maltreatment. They analyzed data from a subset of 1,158 single mothers from the full original study. The investigators reported that single mothers’ perception of community social cohesion has an effect on child maltreatment, and the nature of this effect is influenced by maternal depression: greater social cohesion was associated with lower depression rates, and lower depression was associated with lower child maltreatment rates. These findings demonstrate the importance of social workers attending to both individual and community level factors when developing interventions to prevent or reduce child maltreatment; intervening around community social cohesion might make a difference in child maltreatment because it can influence maternal depression. This is also important because social workers not only care about child well-being, we care about the well-being of mothers, as well.

The two examples (Lanier, et al., 2014 and Barnhart & Maguire-Jack, 2016) demonstrate the greatest advantage associated with administrative and secondary data. The investigators addressed their research questions without having to expend tremendous time and resources in generating new primary data. They avoided duplicating the data gathering efforts that have already been expended. That does not mean that administrative and secondary data analysis studies are easier or less effort-intensive than primary data studies: the effort and time is distributed differently. These studies still need to undergo IRB review for the protection of human subjects to ensure that the risks are minimal or less. These two studies also demonstrate one of the most significant limitations involved with administrative and secondary data. The primary data collection may not have included the best, direct measures of the variables in which the investigators were interested. There may exist a need for faith in the leap of logic that extends between the available data and the variables that the investigators wish to analyze.
Furthermore, using administrative or secondary data leaves the new study vulnerable to any limitations in methodology associated with the primary study or the administrative data. For example, in a study of prisoner visitation patterns by family members, investigators were able to access data concerning every visit made to every state prisoner in Ohio over the preceding five years (Begun, Hodge, & Early, 2017). The study was limited, however, by imprecise and high variability in how family relationships were reported in the administrative data: mother, mother-in-law, step-mother, and parent were all used differently by different recorders and at different institutions. Similarly, someone might be described as a sibling, brother, brother-in-law, step-brother, half-brother, step-sibling, or half-sibling. Thus, the investigators were limited in the degree of detail they could apply to the variable of family relationship—the possible categories had to be combined into more general, less specific categories for the sake of accuracy.
Geographic Information Systems (GIS). You were introduced to geographic information systems (GIS) research in the earlier discussion about correlational studies, and the example about marijuana dispensary density in relation to child maltreatment rates. This is considered a non-intrusive form of data collection, since it is not directly experienced by the individuals whose environments are mapped. The approach can be combined with other, more intrusive approaches, to generate answers to important questions about diverse populations, social work problems, and social phenomena. For example, investigators examined the nature of parents’ engagement with “activity spaces” using both qualitative interview data and GIS methods (Price Wolf, Freisthler, Kepple, & Chavez, 2017). The aim of the study was to better understand how physical and social environments shape parenting behaviors, which in turn, influence child development and health outcomes. They found that parenting had a powerful influence on the places where parents go (child-centric places with their children, “adults-only” places to escape from parenting demands). In addition, day of the week, children’s ages, role as primary or other caregiver, and income all influenced parents’ use of activity spaces by imposing boundaries that limited options. This information provides social work with insights concerning where community-based interventions for parents might best be situated to be accessible for these families, and when different spaces might best be targeted.

Key Informants. One method of collecting data is to have knowledgeable others provide descriptions rather than collecting information directly from individuals. Sometimes this approach is combined with data collection from study participants, as well. Key informants are helpful when studying individuals who cannot effectively share reliable information about themselves—young children, for example, or persons experiencing significant short- or long-term cognitive/intellectual impairments. Child development studies often involve assessment tools completed by parents and teachers. This approach is reasonable when the studied behaviors are observable, but not with studies of internal mental or emotional processes. Great care must also be taken to protect the rights of the individuals being studied.
Surveys. A great deal of social research is conducted using survey tools for data collection. It is important to distinguish between surveys as tools for data collection and survey methodology. Survey methodology refers to how survey study samples are drawn from the population (more about this in Chapter 6) and the use of survey instruments. Surveys are administered through a variety of mechanism: hard copy, paper and pencil surveys; telephone or in-person interview surveys; and, on-line, e-mail or web-based surveys. Most likely, you have participated in surveys from product marketing, course or instructor evaluations, public opinion research, and others.
A great deal has been written about constructing “good” survey instruments and questions. First, it helps to consider the type of information to be provided for a survey question: objective, factual data or information about a person’s subjective opinions, beliefs, attitudes, perceptions, ideas, or states (Fowler & Cosenza, 2009). Asking effective factual questions is not always as simple and straightforward as it may seem. Imagine a study where investigators want to know about a person’s alcohol consumption. They plan to ask study participants:
How often and how much do you drink?
You have probably already identified one problem with this question: drink what? It is very important to clearly define terms in survey questions. The revised question might be:
How often and how much do you drink beverages containing alcohol?
While this question is better defined than the first draft, it still suffers from another common problem: it is a double-barreled question. A double-barreled question is presented as a single question, but actually asks two different questions needing two distinct answers. In this case, one question is about frequency of alcohol consumption, the other is about amount. Recognizing this, the investigators might change their survey to ask:
How often do you drink beverages containing alcohol?
When you drink beverages containing alcohol, how much do you drink?
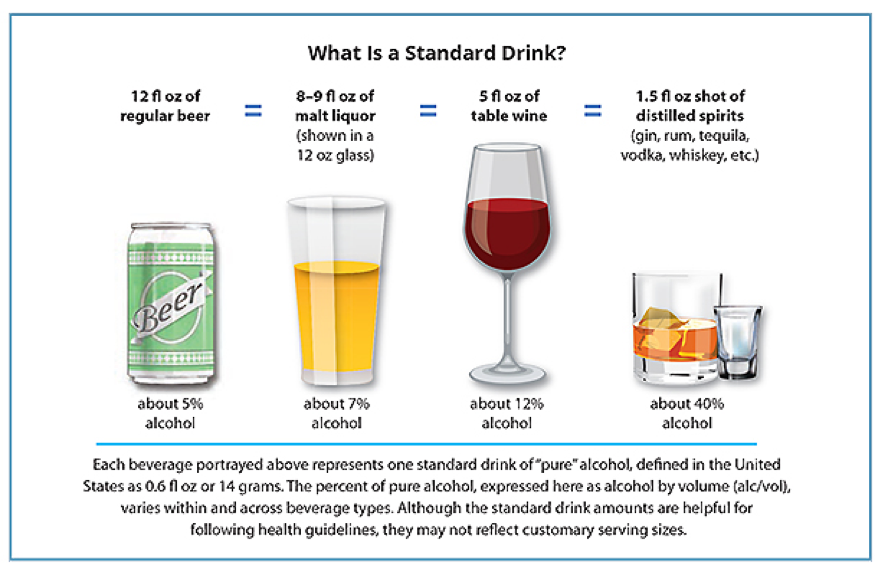
There remains a significant problem with the second of these two questions—a lack of precision about how amounts might be reported. One person might respond “a lot,” another might respond “it depends.” The investigators need to make clear that they are asking for a specific, concrete, objective number here. Still, if a person responds “3” in reference to the number of drinks, the investigators still do not know how much alcohol was consumed because different types of alcoholic beverages contain different amounts of alcohol, and it is unclear how large the 3 drinks might be. Figure 4-1 shows how questions about drinking amounts could be asked.
Figure 4-1. Using the chart* below, on a day that you drink alcohol, how many standard drinks do you consume?
Asking questions about a person’s subjective internal states can also be complicated. As we saw with asking factual questions, defining terms and avoiding double-barreled question both remain important. It is important that the wording of a question not be biased at the outset. Bias can be introduced unintentionally by using specific labels—consider the difference between the labels “victim” and “survivor” of intimate partner violence, for example. Another potential source of bias comes from the phenomenon recognized as social desirability responding. Sometimes the answers people provide reflect what they believe is the most favorable or “correct” response rather than a response that truly reflects their own reality—aiming to be “PC” (“politically correct” rather than accurate. The literature contains several measures of social desirability, questions that can be integrated into a survey, to determine the extent to which an individual’s answers might be suffering from social desirability bias.
In addition, the options provided in the survey for responding to questions need to be carefully considered. Response options include (but are not limited to):
- Open ended or fill-in-the-blank. This option provides the greatest degree of latitude and potential variability in responding. Depending on the nature of the questions asked, the responses can be qualitatively (rather than quantitatively) analyzed. If the goal of the study is quantitative, these types of response are more difficult to work with. Problems include difficulty with interpreting handwriting and spelling errors, or non-standard uses of words or terms. Responses may also vary greatly in terms of how much information and detail different participants provide—some may give a word or two while others provide great amounts of detail. This response variability can be difficult to analyze.
- Yes/no. This option offers only two possibilities, meaning that it is “forced choice” question. This is sometimes used as a screening question to determine the appropriateness of asking further questions on the topic. For example, our investigators asking about alcohol consumption amounts might first ask: Have you consumed any beverages containing alcohol in the past 12 months? Then, they would as the frequency and amount questions only of individuals who responded “yes” to the screening questions; those responding “no” would skip the frequency and amount questions. One problem with force choice questions is that study participants may become frustrated, especially when the answer is not quite so cut and dried. For example, a screening question that asks, “Do you drink beverages containing alcohol?” would be difficult to answer with either “yes” or “no” by a woman who drank until she became pregnant and now does not, but will again after the baby is born.
- Rating scales:Survey questions often ask participants to apply a continuum or rating scale in answering a subjective question. This might be in the form of how much they agree with specific statements, their evaluation of something (degree of goodness, fairness, attractiveness, or other qualities), or estimations about how often something occurs. Two general types of scales exist. One is a single, unidimensional scale, such as rating happiness from low to high. The other is a two-dimensional scale, such as rating affect from unhappy to happy with a neutral value in the middle. It is important when deciding which type of scale to apply that both ends of the two-dimensional scale cannot occur at the same time for the same person. For example, a person might be unhappy about some things and happy about others at the same time. In this case, it would be more informative to have two separate unidimensional scales (one for happiness and one for unhappiness) instead of relying on a single two-dimensional scale, since feeling neutral is very different from feeling both unhappy and happy.
It might be wise, to offer participants options outside of the main choices. Response options like “unsure,” “don’t know,” or “prefer not to answer” might keep someone from either skipping the question or providing an inaccurate response. On the other hand, it may be that a forced choice is desired by the investigators and an alternative, unscaled option is not offered.
Another consideration with rating scales is how many points on the scale are offered. Too few options (e.g., a 3-point scale being 0, 1, 2) may lead to there being very little variation in the responses provided—it would be too easy for everyone to pick the same value, perhaps the middle of the range (ratings of 1). On the other hand, having too many options makes it difficult for people to decide on an appropriate rating—for example, when rating something on a 100-point scale, would there be a meaningful difference between ratings of 70 and 71? It would be easier for someone to use a 10-point scale (where the response might be 7). A common solution is the 5-point scale with two extremes, a neutral midpoint, and two modified options between the midpoint and extremes. For example:
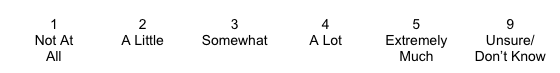
Notice in this example that each possible numeric response has an associated description. In survey terms, these ratings are “anchored” by the words provided. Sometimes a scale is presented with some anchors being unspecified. For example:
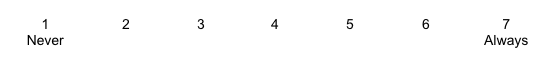
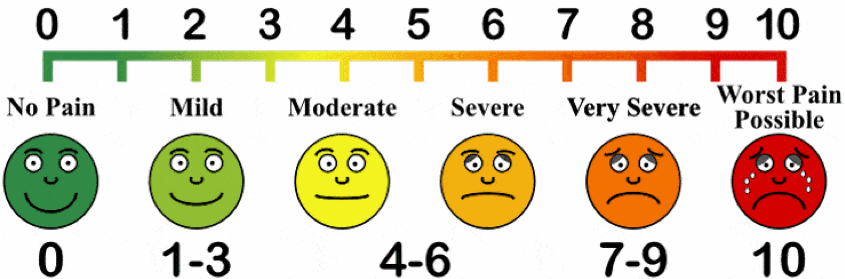
This leaves the meaning of the ratings between 2 to 6 open to individual interpretation. Additionally, the anchors do not have to be words or phrases. For example, symbols or emoticons might be used, especially in working with children. The pain scale is an example that might be usefully modified for surveys (retrieved from www.disabled-world.com/health/pain/scale.php):
A note about Likert scales. A common error in describing survey scales revolves around use of the term “Likert scale.” By definition, a Likert scale is a set of individual items that, in combination, form a single index (or scale). A Likert scale is made up of Likert items. Likert items generally have five or seven options on the rating continuum, but the midpoint is always neutral. Just because items have five rating options arrayed on a continuum does not make it a Likert item—a unidimensional item has no neutral midpoint, so it is not a Likert item. A Likert scale score is calculated by mathematically combining the ratings for individual Likert items, usually as either a total (sum) or as an average (mean) score. In some cases, the developer of a scale might provide alternative scoring instructions (such as multiplying some item ratings to provide weighted scores if some items are more important than others to the meaning of the final score). For example, ratings on the following four Likert items about readiness to succeed in a social work course about research and statistics are simply added together to create a composite Likert scale score for each study participant—one participant’s hypothetical responses are scored in this example, receiving a score of 14 on a possible range of 4 to 20 (see Table 4-1).
Table 4-1. Likert items and Likert scale scoring example
| How much do you agree or disagree with each statement below?
1=completely disagree 2=somewhat disagree 3=neither disagree nor agree 4= somewhat agree 5=completely agree |
Item Rating |
|---|---|
| Research evidence is important for social work practice | 4 |
| Math is relatively easy for me | 2 |
| Intellectual challenges and puzzles are enjoyable to work on | 3 |
| I am confident that I can master the content in this course | 5 |
| Scale Score | 14 |
Reverse scoring scale items. In order to compute a single, composite score by adding ratings together requires all of the items to run in the same direction with regard to the construct being measured. Consider what would happen if the second item (B) had been phrased differently: Math is relatively difficult for me. In this case, the item would be negative with respect to the construct of readiness to succeed in the course. Thus, the rating scale would need to be reversed before the rating values could be added together. In other words, ratings of 1 and 5 would be flipped so that ratings of 1 become 5, and ratings of 5 become 1; similarly, ratings of 2 and 4 would be flipped so that ratings of 2 become 4, and ratings of 4 become 2.
Interactive Excel Workbook Activities
Complete the following Workbook Activity:
Screening and Assessment Tools. Very often, investigators utilize existing screening and assessment tools for measuring the phenomena or constructs of interest in a research study. The literature is rich with measures designed to screen for or assess many different behaviors, conditions, or social work problems. It is usually preferable to use pre-existing measurement instruments rather than creating new ones for a particular study, particularly if the literature supports their reliability and validity for the job (more about this later in this chapter). Electronic search terms that help investigators and practitioners locate pre-existing measures on a specific topic include: tests, measures, measurements, assessment(s), scale(s), and screening.
Locating measures that can be applied in research studies is facilitated by various catalogues, compilations, guides, and handbooks that review them. For example, the Mental Measurements Yearbook(Carlson, Geisinger, & Jonson, 2017) is a frequently updated published resource with information to facilitate the selection of measurement tools by practitioners and investigators. An investigator interested in measures concerning attention deficit with hyperactivity disorder (ADHD) would find at least 4 options reviewed in the series (from 1985 to the present). A listing of all reviewed measures is presented on the publication website (https://buros.org/tests-reviewed-mental-measurements-yearbook-series). Many of the measures are commercially available, meaning that there is potentially a fee associated with their use—they may not be available in the public domain—and many require specialized training or certification.
Additional guides to research measures, including other than clinical behaviors, are:
- Handbook of clinical rating scales and assessment in psychiatry and mental health(Baer & Blais, 2010)
- Handbook of family measurement techniques, v. 1-3(Touliatos, Perlmutter, Straus, & Holden, 2001)
- Handbook of psychiatric measures, 2nded. (Rush, First, & Blacker, 2008)
- Handbook of research design and social measurement, 6thed.(Miller & Salkind, 2002)
- Measures for clinical practice and research, 5thed, v. 1&2(Corcoran & Fischer, 2013)
- Positive psychological assessment: A handbook of models and measures(Lopez & Snyder, 2003)
- Rating scales in mental health(Sajatovic & Ramirez, 2012)
Important cautions revolve around the use of screening and assessment results as research measures. First, investigators must develop procedures for providing test results to study participants, especially those whose results indicate a clinical problem or high risk of developing one. Second, the investigator needs to understand the measurement tool sufficiently well to determine whether actual scores can be used as a scale variable or if the test results can only be relied on for the yes/no dichotomous categories related to whether or not the person meets criteria for the condition being studied. For example, a measure of depression might help determine if a person is “over” or “under” the threshold for meeting depression criteria, but actual raw depression scores cannot be treated as a scale: the difference between a score of 38 and 40 is not the same as the difference between a score of 48 and 50. The AUDIT (Alcohol Use Disorder Identification Test) is an example of a screening instrument that has been used both ways (Babor, Higgins-Biddle, Saunders, & Monteiro, 2010). This screening measure is in the public domain and has 10 items, each of which is rated from 0 to 4 points based on the rubric presented for each item. An AUDIT score of 8 or higher for men, 7 or higher for women, is considered a “positive” screening result, indicating that an alcohol use disorder possibly exists. On the other hand, higher AUDIT scores are indicative of greater risk, and the actual scores can be used as a scale (ranging from 0 to 40). Or, the scores can be broken into 4 categories:
- Zone 1 scores 0-7 intervene with alcohol education alone,
- Zone 2 scores 8-15 intervene with simple advice about alcohol misuse,
- Zone 3 scores 16-19 intervene with simple advice plus brief counseling and continued monitoring,
- Zone 4 scores 20-40 intervene with referral to specialist for diagnostic evaluation and treatment (Babor, Higgins-Biddle, Saunders, & Monteiro, 2010, p. 22).
Interviews. Whether they are engaged in a qualitative, quantitative, or mixed-methods study, investigators may rely on interviews to gather data. Interview protocols vary in terms of the extent to which they are pre-scripted and structured. Qualitative studies in the grounded theory tradition typically are relatively unstructured since the purpose is to learn about the individual’s own perspectives and interpretations about events, processes, or phenomena. The “flow” of such an interview follows from what the study participant shares rather than from a script predetermined by the investigator. At the other end of the continuum, quantitative study interviews typically are quite structured and scripted so as to elicit similar types of information (though varying in content) from each study participant. The semi-structured interview format is situated between the unstructured and highly structure interview formats. The questions in a semi-structured interview are general and open-ended and the “script” may include specific prompts to help guide the process. The research interview requires an investigator to employ many of the same skills used in social work clinical practice.
An important characteristic defining interview questions is whether they are open- or close-ended questions. Questions that can be answered with simple statements of fact or with yes/no responses are close-ended questions. An example might be:
How many brothers and sisters lived with you 50% of the time or more when you were growing up?
The answer to this question is likely to be short and factual (objective). On the other hand, an open-ended question requires the person to elaborate on the information being shared. For example:
If you had to pick the one brother or sister to whom you feel emotionally closest, who would it be and why?
A common error that interviewers make is failing to frame questions in open-ended format when they are seeking rich, descriptive responses. Even with open-ended questions, prompts to keep the story expanding may be necessary:
Can you tell me more about that?
What else should I know about it?
I am not sure I understand. Can you explain it to me differently?
Interview data might be recorded in notes kept by the interviewer, audio recordings, video recordings, or notes kept by a third-party observer. Ideally, more than one strategy is utilized in order to ensure the most complete data—any of these approaches can fail or data from one approach might be unintelligible/unreadable later. It is helpful to have multiple forms for cross-checking and completion purposes. Furthermore, they complement each other. For example, tone of voice and meaningful pauses may be detected in an audio recording but not be evident in written notes or transcripts of the interview dialogue. Video recordings may pick up nonverbal cues that are missed in audio-only or written transcript records.
Focus Groups. A focus group is essentially a group interview. There are two main reasons for using focus group procedures rather than individual interviews. The first is that it might be more practical, feasible, or advisable to meet with small groups rather than individual study participants. For example, information might be gathered from 6 individuals in a 90-minute group session more quickly than in 6 separate 30- or 60- minute interviews. The second (and perhaps more important) reason is that the focus group participants may build off each other’s comments in such a way that a more rich, in-depth picture emerges from the whole group than would emerge from assembling information provided by 6 separate individuals. A third reason is that individuals may feel more comfortable discussing certain topics in a group context than in individual interviews with an unfamiliar investigator. Of course, the opposite may also be true: some may feel more comfortable discussing the topic individually rather than in a group.

Focus group methodology was used in a study of the importance of HIV/AIDS prevention education among older adults (Altschuler & Katz, 2015). The investigators hosted five 90-minute focus groups with adults aged 50 to 82 years. The study was prompted by the observation that increasing numbers of older adults are living with HIV/AIDS, prevention education efforts are seldom targeted/delivered to older adults, and programs serving older adults seldom address HIV/AIDS prevention education. They wanted to learn from study participants what they recommend, what would motivate them to participate in HIV/AIDS prevention education or to seek such information. This information was shared in responding to 5 general questions in a semi-structured group interview context. Transcripts of the recorded focus group sessions were thematically coded by the investigators. Analyses led to the identification of 4 themes:
- Wanting to learn about the topic was fostered by knowing someone who has HIV/AIDS or a general sense of compassion for these individuals.
- Recommending that HIV/AIDS prevention education be delivered in settings where older adults work or volunteer.
- Reminding others that despite stereotypes, older adults remain sexually active “both within and outside of monogamous relationships,” and therefore remain at risk for exposure (Altschuler & Katz, 2015, p. 694).
- Ambivalence about discussing the topic with their medical care providers and discomfort with how providers responded to their questions about this topic.
The investigators concluded that HIV/AIDS prevention education is appropriate and needed among older adults, and the study participants provided insight as to how this might best be undertaken.

Journaling and Ecological Momentary Assessment (EMA). One problem with relying on surveys, questionnaires, clinical instruments, and interviews is that much of the information individuals are asked to provide is retrospective prospective in nature. In other words, people are asked to describe what has happened in the past or what they believe will happen in the future. Unless the questions are about the “here and now,” people are not providing information about what is happening in real time, as it happens. We learned back in Module 1 that recalled information is only as good as the person’s memory and how memories are constantly being revised by experiences and interpretation processes.
To improve the quality of information provided by study participants, investigators might ask them to maintain a log, diary, or journal on a frequent, routine, automatic basis, or as the phenomenon of interest occurs. For example, if the study is about anxiety, the person might write down answers to a set of questions about each anxiety episode as it is happening or as soon after as possible. Not only would this provide investigators with the ability to count the frequency of anxiety episodes, they would also have information about episode intensity, what preceded each episode, and what might have helped the person resolve each episode. The data can be analyzed more contextually than would be possible without these event records, using more global, retrospective accounts.

Another format for collecting event data is called ecological momentary assessment (EMA). This approach minimizes recall and memory bias by sampling an individual’s behavior or experiences at periodic intervals (Shiffman, Stone, & Hufford, 2008). A study participant may be signaled by the investigators at either regular or random times throughout the day or week to immediately record information about what is happening. This approach has been used in a number of alcohol-related studies to help investigators understand how alcohol use is influenced by situational, contextual circumstances—cravings, stress, affect, motivation to drink, motivation to abstain from drinking, concurrent other substance use, social and place factors (Wray, Merrill, & Monti, 2014). The approach is also presented as a possible technology assist to treating alcohol use problems by providing real-time support rather than supporting individuals’ change efforts on a clinic or office schedule (Morgenstern, Kuerbis, & Muench, 2014). EMA data are collected from individuals as they function in their natural environments. The data are sensitive to naturally occurring fluctuations and patterns in the behavior of interest, rather than relying on a single, retrospective summary of the behavior. This is particularly important when what is being studied is dynamic—frequent changes in mood, behaviors influenced by environmental context, transitory thoughts or feelings, for example. EMA is facilitated by technology—cell phone access, text messaging, and web-based survey tools that can be accessed from most locations. The method is sometimes limited by certain contexts, such as schools, jails, bathrooms, locker rooms, driving, and other situations/settings where use of these technologies is discouraged or banned.

Concept Map. An individual or group process approach to understanding social phenomena is called a concept map. The result of this process is a diagram depicting how ideas about a topic are related, possibly as a web of ideas. While concept mapping is useful in social work practice with individuals, families, small groups, communities, and organizations, it also can be useful in conducting exploratory or descriptive research studies. The underlying research philosophy and methodology are essentially qualitative in nature, involving a structured step-by-step approach to achieve the end goals; the approach also involves both qualitative grouping of concepts and the use of statistical methods to analyze participant input in generating the resulting concept map.
“Concept mapping is a structured process, focused on a topic or construct of interest, involving input from one or more participants, that produces an interpretable pictorial view (concept map) of their ideas and concepts and how these are interrelated” (Trochim & Donnelly, 2007, p.27).
A team of investigators utilized concept mapping as a method for exploring types of support needs identified by a group of diverse sexual minority youth (Davis, Saltzburg, & Locke, 2010). The 20 study participants were served by a GLBTQ youth-focused. The participating youth generated 58 statements of need in the “idea generation” phase of the process. Next, each individual participant sorted the collection of statements in clusters that were conceptually meaningful to them, and provided a label for each of their item clusters. This step concluded with each participant rating each statement on a 7-point scale of importance (not important to extremely important) in meeting their emotional or psychological needs and again in meeting their social needs as a GLBT youth. The investigators used these data in multidimensional scaling statistical analysis, and generated concept maps.
“Concept maps were produced, providing graphic representations of relationships and relevance of the ideas. The maps illustrated how the youths’ ideas clustered together and the rating data reflected the value given to each conceptual idea and cluster” (Davis, Saltzburg, & Locke, 2010, p. 232).
The study participants next engaged with the investigators in group discussions about how to interpret the preliminary concept mapping results. A combination of additional qualitative and statistical methods led to the final results. The youth’s statements fit into 5 clusters of needs (educating the public, policies, community support & involvement, individual responsibilities, and GLBTQ acceptance & individuality). In terms of importance, the highest ratings were assigned to “policies” statements, lowest to “community support & involvement” statements. Results from studies like this have important implications for planning culturally and developmentally relevant services in programs, organizations, communities, and service delivery systems—both in terms of process and products.
Social networks. Another method that allows graphical depiction of relationships comes from asking questions about social networks and using research methods designed to gather social network data. Social networks are the patterns of formal and informal connections that exist between individual units in complex social systems. Social network maps depict the strength and/or frequency of connections between individual units (individual persons or groups). A great deal of such research is conducted using social media interaction data, for example. Questions about how ideas, rumors, or innovations are disseminated or diffused can be answered in this manner. Social network analysis allows investigators to identify key “nodes” or “nodal points” where different networks connect, as well. Questions about how people use their social networks might rely on other forms of data collection (survey or interview questions, for example). This type of research helps us understand how social relationships and social contexts influence human behavior.
Social network data collection and analysis was used in a study to understand the phenomenon of suicide diffusion among youth social networks—how suicidality might spread among adolescents (Mueller & Abrutyn, 2015 ). These investigators used data previously collected in the National Longitudinal Study of Adolescent to Adult Health to map how suicidal ideation and suicide attempts by individual adolescents (“ego” individuals) might be influenced by suicide attempts of their friends (“alter ego” individuals). Ego individuals who knew about an alter ego’s attempted suicide (disclosed suicide attempt) during the past year experienced higher levels of emotional distress and suicidality themselves compared to egos with an alter ego whose suicide attempt was undisclosed (ego did not know about it) or whose alter egos had no previous suicide attempts. The authors did find evidence of “the social contagion of negative emotions” but that emotional contagion alone is not relevant to the social contagion of suicide (Mueller & Abrutyn, 2015, p. 144).

Take a moment to complete the following activity.
Chapter Summary
In summary, there exist many options for collecting qualitative and quantitative data in social work research. The issues of measurement validity and reliability are important concerns for quantitative research. Ensuring the appropriateness and cultural competence of measurement approaches and procedures is also critically important in any type of research involving people as participants.
