Module 1: Introduction & Overview
Ch. 2: Who (Mis)Uses These Substances?
If you are wondering just how common substance use and substance use disorders are, you will soon find this to be a more complex question that it might at first appear to be. The answer varies by:
- type of substance
- age group
- gender
- geographic location
- ethnicity, and
- co-occurring problems.
Based on the popular media, you might have the impression that just about everyone is misusing drugs (except maybe you and a few people in your personal network); this just isn’t so. The science of epidemiology can help us pinpoint what actually IS going on in terms of trends and patterns related to substance use and misuse, as well as the experience of substance use disorders and other negative consequences.
Before you read on, take a moment to jot down your best guess answers to the following questions:
- What do you think are the 2 or 3 most commonly used substances?
- What percentage of people aged 12 and older do you think use each of those most common substances that you identified?
- What do you predict is the distribution of men versus women using these substances?
- What age group do you predict is the highest user of the substances that you identified?
- What did you predict about the patterns of substance use among people who are white, black, Hispanic/Latino, and Native American?
- What percentage of the population do you think has a diagnosable substance use disorder?
 Epidemiological Studies
Several large-scale epidemiological studies are routinely conducted in the United States that help us develop a picture concerning the prevalence and incidence rates for substance use and substance use disorders. Still other studies provide insight about global patterns. Here are some findings from approximately 57,146 persons aged 12 and over, living in the United States, who responded to the 2015 National Survey on Drug Use and Health (NSDUH) reported by the Substance Abuse and Mental Health Services Administration (SAMHSA, 2016).
Type of Substance: What is most commonly used substance? Alcohol. Just over half of survey participants indicated that they had used alcohol during the past month (52 percent). This translates to over 138 million Americans considered as “current drinkers.” Keep in mind that, although alcohol was the substance most commonly used, only a portion of people who drink alcohol do so in potentially problematic ways (see Figure 1).
Figure 1. Percent reporting past month drinking alcohol, binge drinking, and heavy drinking (derived from SAMHSA, 2016 report for persons aged 12+)
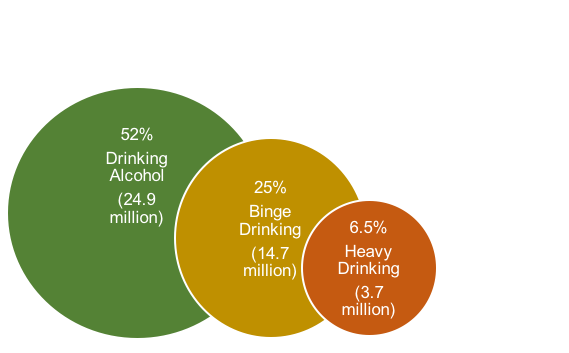
The NSDUH study investigators defined past month binge drinking as five or more drinks containing alcohol on the same occasion on at least one day out of the past 30 days. According to NIAAA, drinking in a manner that raises a person’s blood alcohol concentration (BAC) to 0.08g/dL or higher is binge drinking. By comparison, past month heavy drinking was defined in the survey as five or more drinks on the same occasion, on each of five or more days in the past 30 days. The amount and rate of alcohol consumption will be factors in this outcome, along with aspects of individual differences in constitution. In general, for women this means about four drinks in about two hours or five drinks in two hours for men. This pattern sometimes is referred to as risky single occasion drinking (RSOD).
The World Health Organization (WHO, 2014) has identified alcohol as a significant factor in global disease (and death) burden. The harmful use of alcohol is defined as:
drinking that causes detrimental health and social consequences for the drinker, the people around the drinker and society at large, as well as the patterns of drinking that are associated with increased risk for adverse health outcomes (p. 2).
According to the WHO report, the harmful use of alcohol is associated globally with an estimated 3.3 million deaths annually.
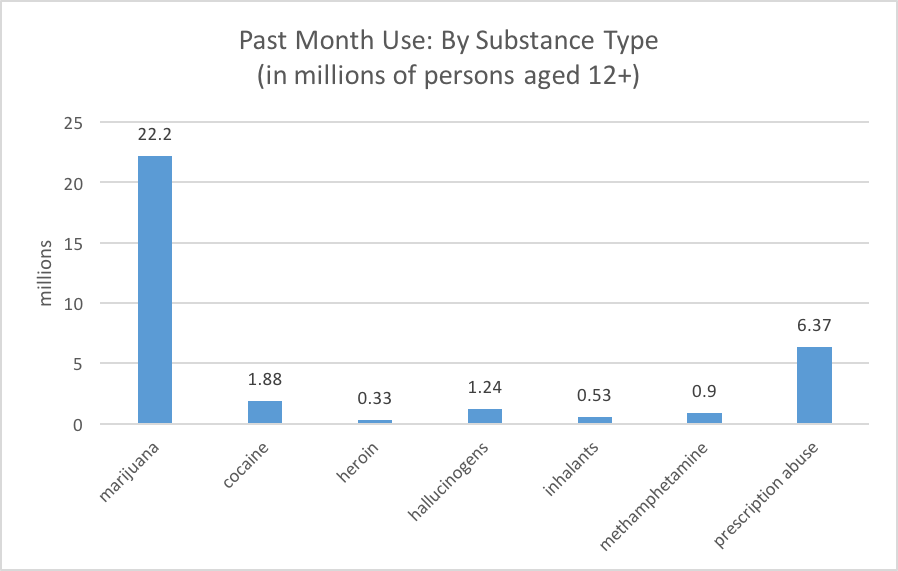
In comparison, an estimated 27 million individuals (about 10.1 percent of the population) aged 12 and over used illicit (illegal) drugs during the surveyed month. The type of illicit drug most often used, by far, was marijuana (see Figure 2). The next most common was the misuse of prescription psychotropic drugs. Less commonly used were cocaine, hallucinogens, heroin, and methamphetamine.
Figure 2. Past month use of various substances (SAMHSA, 2016)
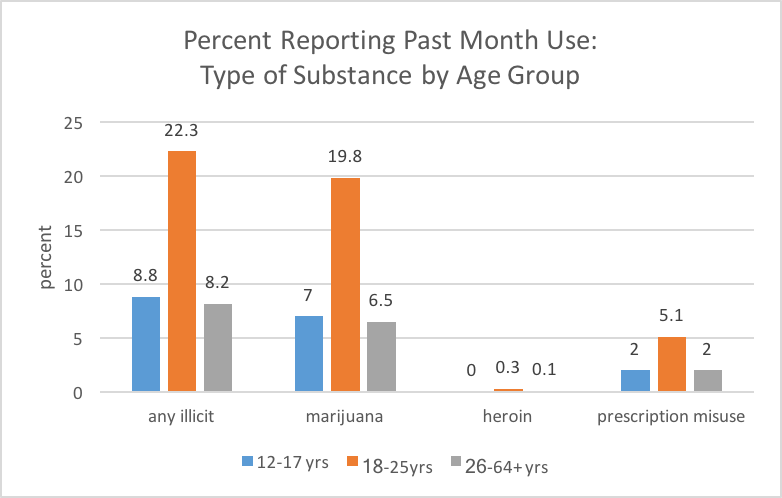
Type of Substance by Age: In the 2015 NSDUH survey (SAMHSA, 2016), patterns of alcohol and illicit drug use can be calculated for each of the following age groups: 12-17 year olds (youth), 18-25 year olds (emerging adults), 26-64 year olds (adults), and those aged 65 and older. Technically, alcohol is an illicit substance for underage youths (those aged 12-17 in the survey), but for comparison purposes we will include those statistics with the adult drinking statistics. Figure 3 shows the percent reporting past month use of alcohol, binge drinking, and heavy drinking by age group. These numbers all peaked for our emerging adult group. Past month use of illicit drugs was highest among emerging adults (18-25 year olds), and within that adult group, the rate began a steady decline in percentage rate after age 26 (see Figure 4).
Figure 3. Patterns of past month alcohol use by age group.
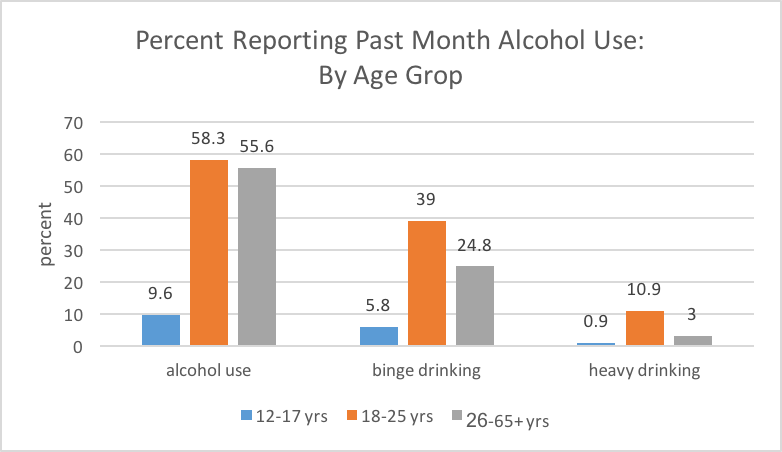
Figure 4. Patterns of past month illicit drug use by age group.
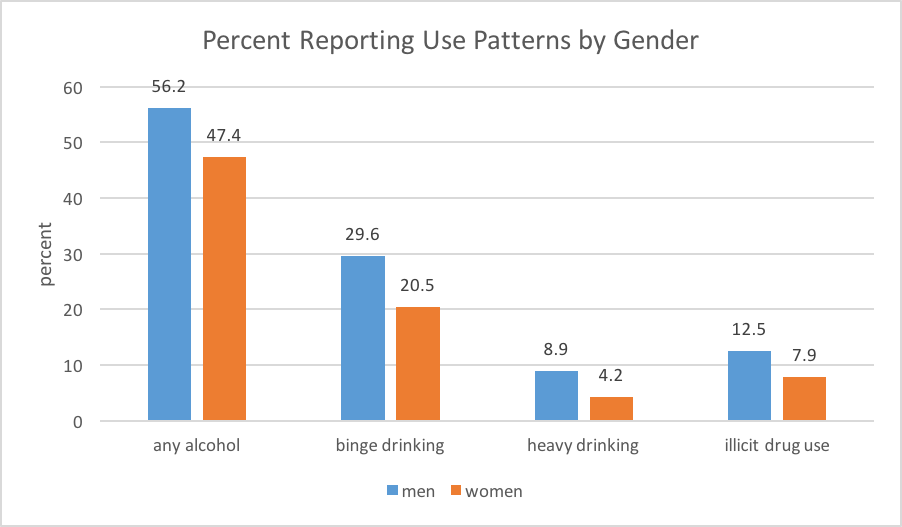
Type of Substance by Gender: Both alcohol and illicit drug use were more common among adult men than women (see Figure 5). This pattern of gender difference in illicit drug use was not observed among 12 to 17 year olds: the girls reported illicit drug use patterns similar to the boys in this age group (8.8%). The gender differences in illicit drug use first appeared among 18-25 year olds (emerging adults). However, among 12 to 17 year olds, higher percentages of girls (9.9%) than boys (9.3%) reported using alcohol; men drinkers outnumbered women drinkers among those over the age of 18, and potentially harmful patterns of drinking (binge and heavy drinking) were more commonly reported by men than women in the entire 12+ years sample (see Figure 5).
Figure 5. Drinking and illicit drug use past month patterns by gender for persons aged 12+ years
Of considerable concern are the findings that 9.3 percent of pregnant women reported using alcohol and 4.7 percent reported illicit drug use during pregnancy. This represents an unfortunately high rate of fetal exposure to these potentially damaging substances.
Type of Substance by Race and Ethnicity: The seven U.S. racial/ethnic groups for whom information is reported in the 2015 NSDUH survey include: white; black/African American; Hispanic/Latino; Asian; American Indian/Native Alaskan; Native Hawaiian/Other Pacific Islander; and, those who report being of two or more races.
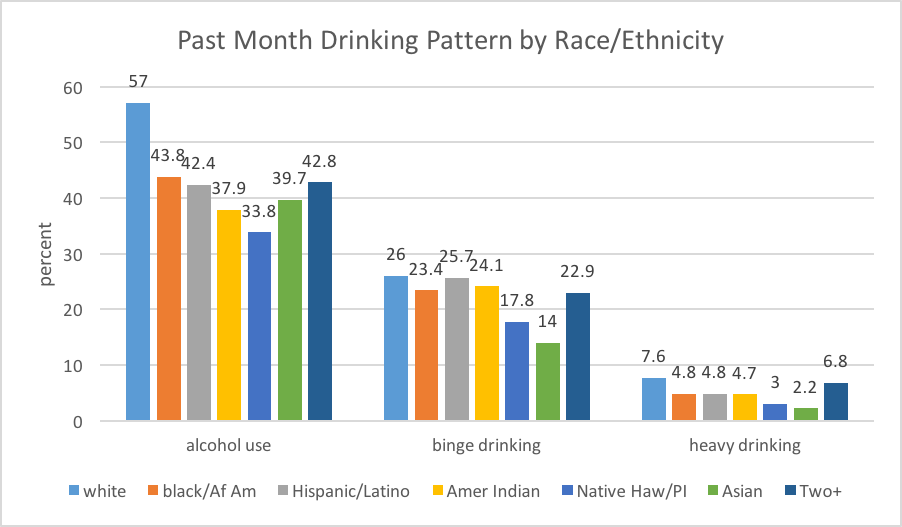
The group most likely to report past month use of alcohol was comprised of individuals who identified themselves as white (see Figure 6), and the lowest rates were reported by Asian and Native Hawaiian/Other Pacific Islander groups. Looking at these statistics another way, the highest rates of drinking abstinence in the past month appeared among the Native Hawaiian/Other Pacific Islander and American Indian groups.
The picture is slightly different when looking at the binge-drinking pattern, however. The binge-drinking rate remained highest among individuals who self-identify as white, with the rate for Hispanic/Latino individuals being almost equal; those who self-identified as Asian had the lowest binge drinking rates. Heavy drinking, again, was at the highest rate among white individuals; somewhat lower and almost equal were the rates among Hispanic/Latino, black/African American, and American Indian individuals.
Figure 6. Past month drinking patterns reported by race/ethnicity
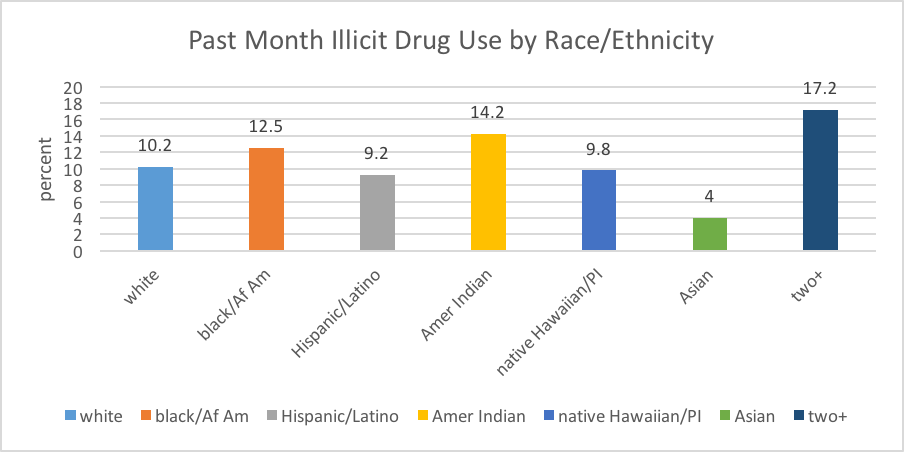
The group reporting the highest rate of past month illicit drug use was the group who self-identified as belonging to two or more races and the lowest rate was reported among Asian individuals (see Figure 7).
Figure 7. Past month illicit substance use by race/ethnicity

Now that you have read the information, take a moment to compare what you learned as answers to the questions below with your pre-reading answers:
- What are the 2 or 3 most commonly used substances?
- What percentage of people aged 12 and older use each of those most common substances?
- What is the distribution of men versus women using these substances?• What age group is the highest user of these substances?
- What are the patterns of substance use among white, black, Hispanic/Latino, and Native American persons?
- What percentage of the population has a diagnosable substance use disorder?
Were you surprised by any of the answers? What factors, information, or experiences do you think led you to guess the right or wrong answers?
