Chapter 18: Scientific Visualization
18.2 Visualization Systems

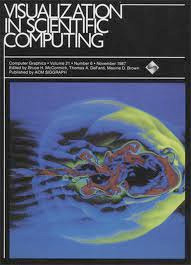
In 1987 an ACM-SIGGRAPH panel released a report done for the National Science Foundation, Visualization in Scientific Computing, that was a milestone in the development of the emerging field of Scientific Visualization. As a result, the field was now on the radar screen of funding agencies, and conferences, workshops and publication vehicles soon followed.
Publication of this NSF report prompted researchers to investigate new approaches to the visualization process and also spawned the development of integrated software environments for visualization. Besides several systems that only addressed specific application needs, such as computational fluid dynamics or chemical engineering, a few more general systems evolved. Among these were IBM’s Data Explorer, Ohio State University’s apE, Wavefront’s Advanced Visualizer, SGI’s IRIS Explorer, Stardent’s AVS and Wavefront’s Data Visualizer.Two lesser known but important systems were Khoros (from the University of New Mexico) and PV-WAVE (Precision Visuals’ Workstation Analysis and Visualization Environment), originally from Precision Visuals, Inc., but later owned by Visual Numerics, Inc. (VNI).
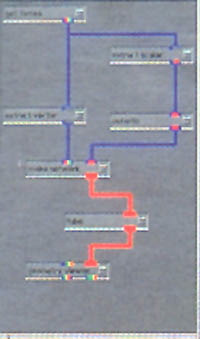
These visualization systems were designed to take the burden of making the visualization image off of the shoulders of the scientist, who often didn’t know anything of the graphics process. The most usable systems therefore utilized a visual programming style interface, and were built on the dataflow paradigm: software modules were developed independently, with standardized inputs and outputs, and were visually linked together in a pipeline. They were sometimes referred to as modular visualization environments (MVEs). MVEs allowed the user to create visualizations by selecting program modules from a library and specifying the flow of data between modules using an interactive graphical networking or mapping environment. In a MVE dataflow diagram, the boxes represent process modules, which are linked by lines representing the flow of data between the modules. Maps or networks could be saved for later recall.
General classes of modules included:
- data readers – input the data from the data source
- data filters – convert the data from a simulation or other source into another form which is more informative or less voluminous.
- data mappers – convert it into another completely different domain, such as 2D or 3D geometry or sound.
- viewers or renderers- rendering the 2D and 3D data as images.
- control structures – examples include initialization of the display device, control of recording devices, open graphics windows, etc.
- data writers – output the original or filtered data
Advantages of MVEs included:
- Required no graphics expertise
- Allowed for rapid prototyping and interactive modifications
- Promoted code reuse
- Extensible- allowed new modules to be created
- Reasonably powerful and complete for a broad range of problems
- Often allowed computations to be distributed across machines, networks and platforms
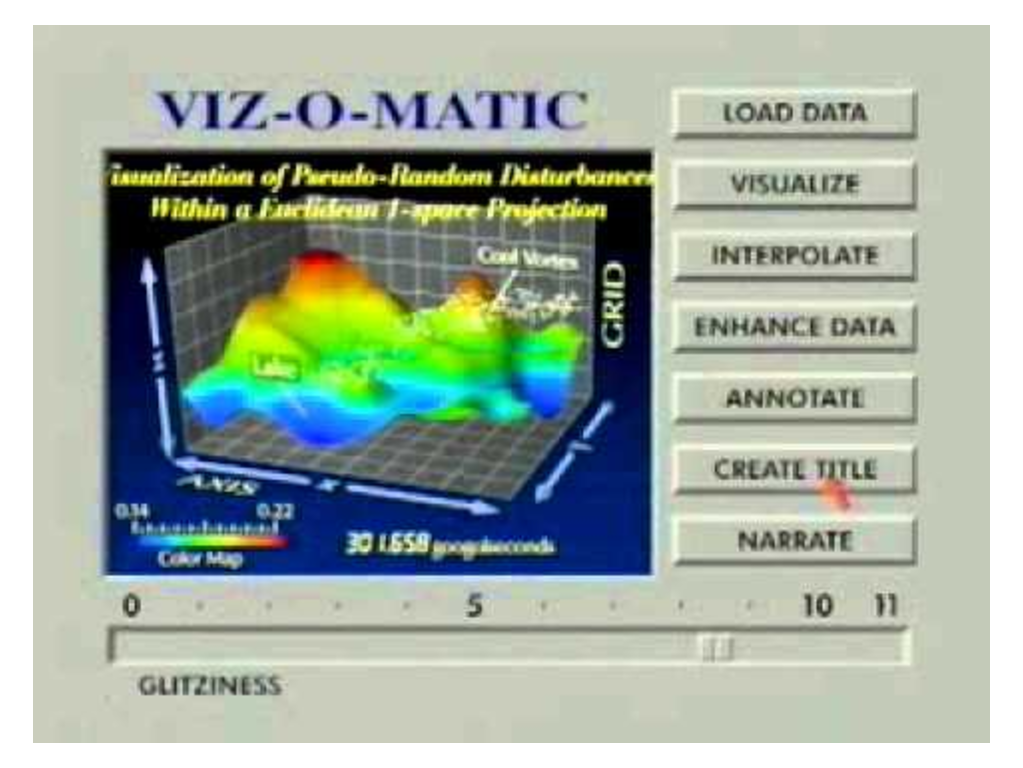
The problem with such packages included poor performance on large data sets, they were more restrictive than general programming environments, they were often not built on accepted graphics standards, and their ease of use sometimes promoted poor visualizations (this often involved a “high glitz factor”).
Wayne Lytle, who worked with the Cornell Theory Center, produced this parody of scientific visualizations for SIGGRAPH 93, called The Dangers of Glitziness and Other Visualization Faux Pas, using fictitious software named “Viz-o-Matic.” The video documents the enhancement and subsequent “glitz buffer overload of a sparsely data-driven visualization trying to masquerade as a data-driven, thoughtfully rendered presentation,” according to Lytle.
Movie 18.1 Viz-O-Matic
https://www.youtube.com/watch?v=fP-7rhb-qMg
Viz-o-Matic – The Dangers of Glitziness and Other Visualization Faux Pas, or What’s Wrong With This Visualization?
by Wayne Lytle – Cornell University Theory Center, 1993.
