Chapter 18: Scientific Visualization
18.5 Volumes
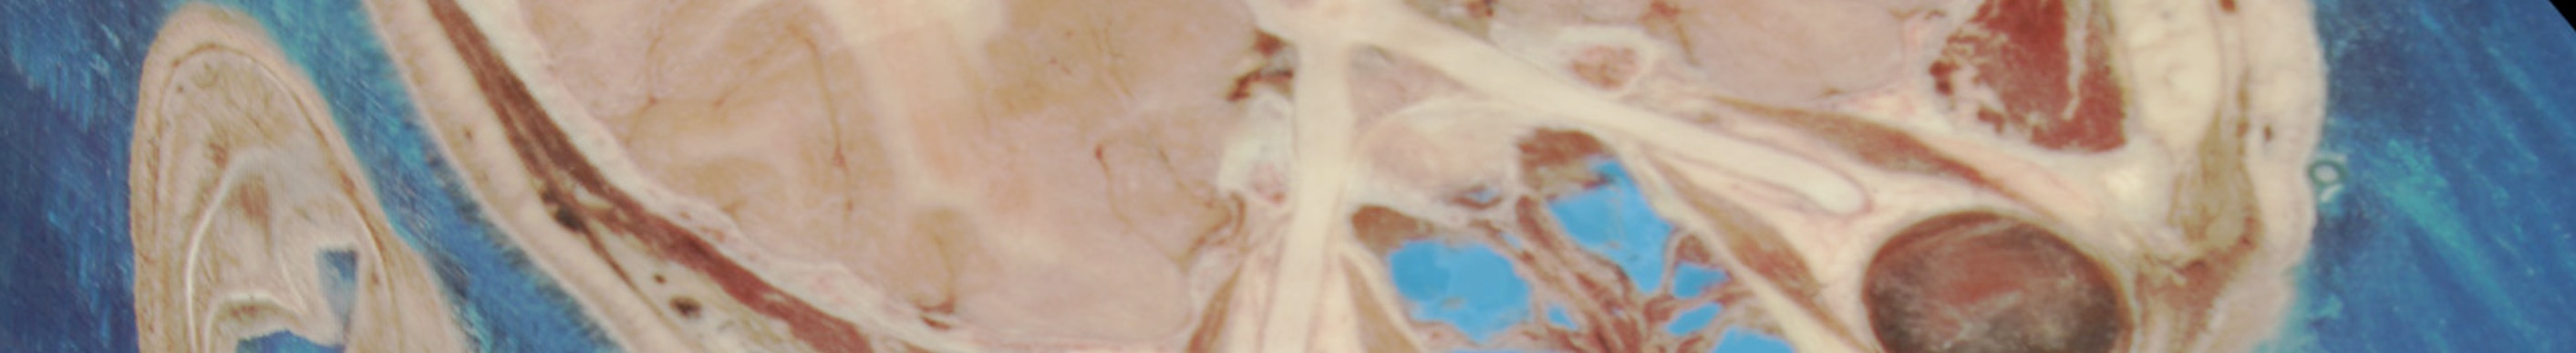
Another major approach to 3D visualization was Volume Rendering. Volume rendering allows for the display of information throughout a 3D data set, not just on the surface. There are several famous methods of volume rendering that should be discussed. The first was developed at Pixar for the Pixar Image Computer in 1988 by Robert Drebin and others. The algorithm used independent 3D cells within the volume, called “voxels“. The basic assumption was that the volume was composed of voxels that each had the same property, such as density. A surface would occur between groups of voxels with two different values. The algorithm used color and intensity values from the original scans and gradients obtained from the density values to compute the 3D solid.
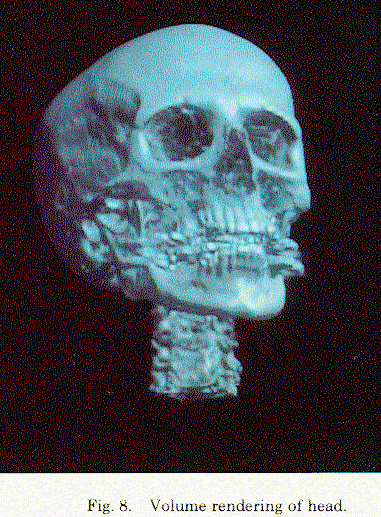
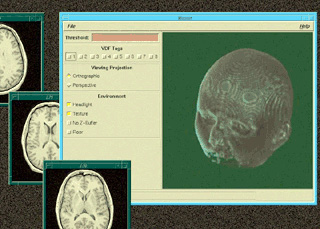
The second approach used ray-tracing. The basic idea was to cast rays from screen pixel positions through the data, obtain the desired information along the ray, and then display this information. The data could be an average of the data in a cell, called a “voxel”, or of all cells intersected by the ray, or some other such measure. This was used in areas such as medical imaging and displaying seismic data. The first major contribution was by Marc Levoy of the University of North Carolina in 1988. There have subsequently been many variations on the ray-tracing volume rendering approach.
A third approach was developed by Lee Westover of UNC. Splatting is a volume rendering algorithm that combines efficient volume projection with a sparse data representation. In splatting, the final image is generated by computing for each voxel in the volume dataset its contribution to the final image. Only voxels that have values inside a determined iso-range need to be considered, and these voxels can be projected via efficient rasterization schemes. In splatting, each projected voxel is represented as a radially symmetric interpolation kernel, equivalent to a fuzzy ball. Projecting such a basis function leaves a fuzzy impression, called a footprint or splat, on the screen. The algorithm works by virtually “throwing” the voxels onto the image plane. The computation is processed by virtually “peeling” the object space in slices, and by accumulating the result in the image plane. Splatting traditionally classified and shaded the voxels prior to projection, and thus each voxel footprint was weighted by the assigned voxel color and opacity.
As previously discussed, the representation of the data draws from many disciplines such as computer graphics, image processing, art, graphic design, human-computer interface, cognition, and perception. Donna Cox, from the School of Art and Design and the National Center for Supercomputing Applications at the University of Illinois, Urbana-Champaign, understood the potential of bringing scientists and visual design artists together to address the big picture of data visualization. In 1987 Cox developed the concept of “Renaissance Teams,” a team of domain experts and visualization experts whose goal was to determine visual representations which both appropriately and instructively presented domain specific scientific data. As Vibeke Sorenson said in a 1989 essay,
“the accumulated knowledge of the fine arts can be extremely useful to Scientific Visualization, a field which will rely more and more on visual skills and ideas. A study of art history can help to gain insights into visual form-giving and unique ways of solving problems which could enhance the scientific research environment in new and unexpected ways.”
A similar approach was the basis for the ACCAD and OSGP groups at Ohio State, at Cornell, and at many other visualization centers.
Cox, D. “Renaissance Teams and Scientific Visualization: A Convergence of Art and Science”, Collaboration in Computer Graphics Education, SIGGRAPH 88 Educator’s Workshop Proceedings, August 1-5, 1988, p. 81 – 104.
http://www.ncsa.uiuc.edu/People/cox/
Sorensen, Vibeke, The Contribution of the Artist to Scientific Visualization, 1989
http://visualmusic.org/Biography/Index.html
Drebin, R. A., Carpenter, L., and Hanrahan, P. Volume Rendering. Computer Graphics 22, 4 (Aug. 1988), 65–74.
Marc Levoy, Display of Surfaces from Volume Data, IEEE Computer Graphics and Applications, v.8 n.3, p.29-37, May 1988
Westover, L., Splatting: A Parallel, Feed-Forward Volume Rendering Algorithm. PhD Dissertation, July 1991
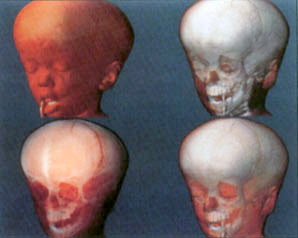
David Y. Yun, Hong-Mei C. Garcia, Seong K. Mun, James E. Rogers, Walid G. Tohme, Wayne E. Carlson, Stephen May, and Roni Yagel. “Three Dimensional Volume Visualization in Remote Radiation Treatment Planning”, Proceedings of the IS&T/SPIE Symposium on Electronic Imaging: Science and Technology, Visual Data Exploration and Analysis III, The International Society for Optical Engineering, IS&T/SPIE Proc. 2656, February, 1996.
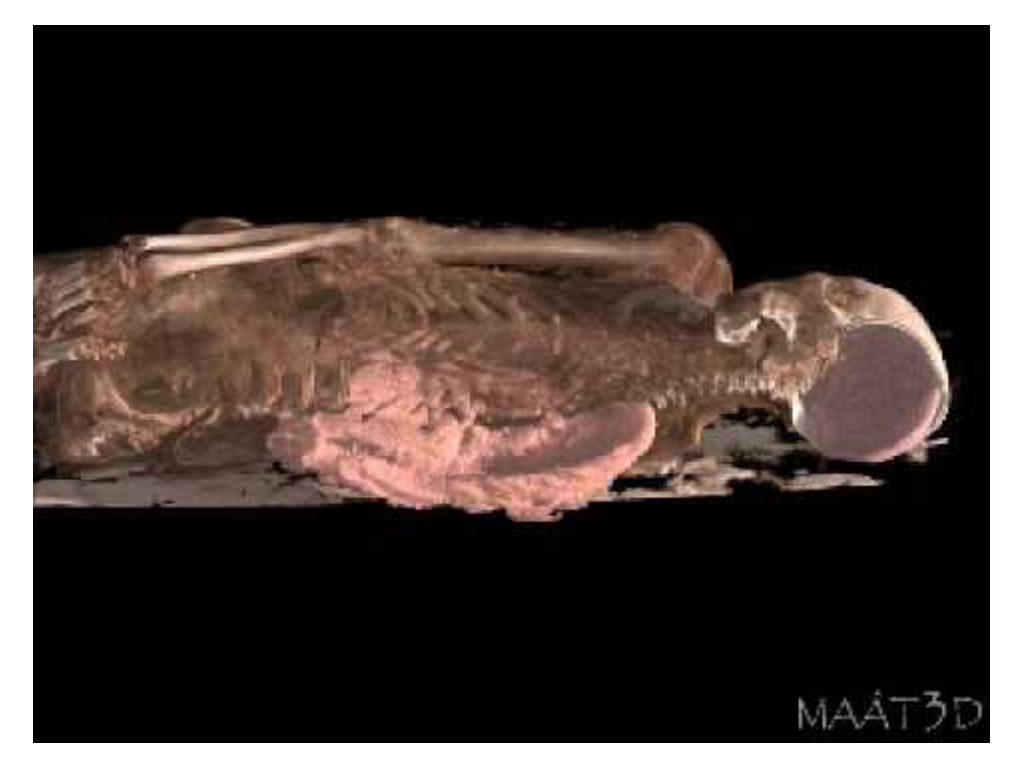
Movie 18.5 Egyptology: 3D Mummy
https://www.youtube.com/watch?v=Il8gZbD9bkM
Medical Visualization: Egyptology in 3D – A revealing high-resolution look at a 2300-year-old mummy – Renderings of the Champollion mummy in VGStudio Max 2.0 reveal the mummy’s physiology through transparentized wrapping layers (Toulouse France, 2006)
