Chapter 18: Scientific Visualization
18.3 Hardware and Software
In the mid 80’s, Stellar Computer was marketing a graphic supercomputer. To demonstrate the capabilities of their hardware, they developed a software package called Application Visualization System (AVS) that they gave away with the hardware. AVS was one of the first integrated visualization systems, and was developed by Digital Productions veteran Craig Upson and others. Over time, Stellar merged with Ardent Computer to become Stardent Computer. When business conditions changed, some of the engineering staff and management of Stardent formed a new company called Advanced Visual Systems, Inc. to continue the development of the AVS product line.
-

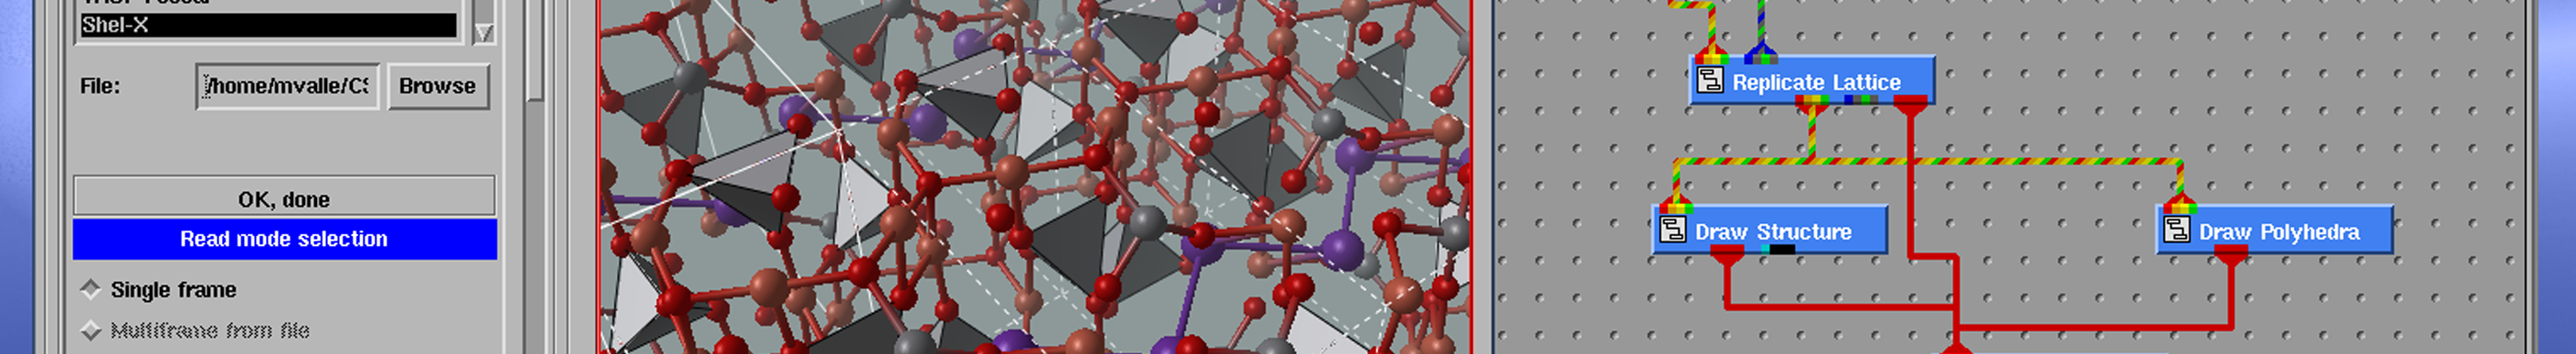
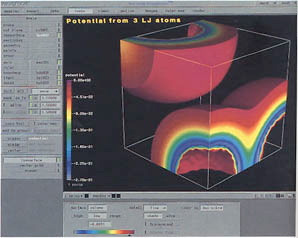
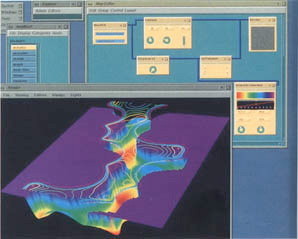
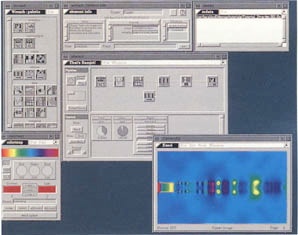
- Screenshots from AVS
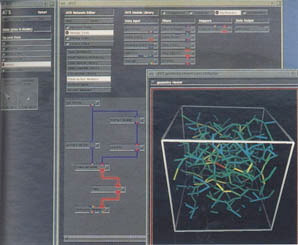
The computational model of AVS was based on a collection of parametric modules, that is, autonomous building blocks which could be connected to form larger data processing networks. Each module had definite I/0 dataflow properties, specified in terms of a small collection of data structures such as field, colormap, or geometry. The Network Editor, operating as a part of the AVS kernel, offered interactive visual tools for selecting modules, specifying connectivity and designing convenient GUIs to control module parameters. A set of base modules for mapping, filtering, and rendering was built into the AVS kernel. The user extensibility model was defined at the C/Fortran level, allowing for new modules to be constructed and appended to the system in the form of independent UNIX processes, supported by appropriate dataflow interfaces.
Other visualization systems came out of the commercial animation software industry. The Wavefront Advanced Visualizer was a modeling, animation and rendering package which provided an environment for interactive construction of models, camera motion, rendering and animation without any programming. The user could use many supplied modeling primitives and model deformations, create surface properties, adjust lighting, create and preview model and camera motions, do high quality rendering, and save the resulting images for writing to video tape. It was more of a general graphics animation system, but was used for many scientific visualization projects.
Iris Explorer was a data-flow, object-oriented system for data visualization developed by G. J. Edwards and his colleagues at SGI. The product was later marketed by NAG (Numerical Applications Group). Like other dataflow systems, it allowed the user to connect pre-built modules together using a “drag and drop” approach. The modules were X Windows programs developed in C or FORTRAN, and was built around the OpenGL standard.
Iris Explorer had three main components:
- The Librarian module contained the list of modules and previously created maps
- The Map Editor was the work area for creating and modifying maps.
- DataScribe was a data conversion tool for moving data between Explorer and other data formats
A map was a dataflow network of modules connected or “wired” together. The user wired together the modules by connecting the appropriate ports, e.g. the output port of one module to the input port of the next module. Each module accepted data, processed it, and then output it to the next module. A map could be created and then stored for future use. It could also be made part of another map.
Explorer Data Types
- Parameter (scalar)
- Lattice (array, including images)
- Pyramid (irregular grid)
- Geometry (Inventor-based)
- Pick (user interaction with geometry)
- In addition, users could define their own types with a typing language
In 1984, Ohio State University competed for an NSF supercomputer center, but was unsuccessful. So the University took the proposal to the state legislature, who established the Ohio Supercomputer as a state center in 1987. One of the reasons for the success of the proposal was the connection with Ohio State’s very highly regarded Computer Graphics Research Group, which became the Advanced Computing Center for the Arts and Design at about the same time. The connection was made formal when the Ohio Supercomputer Graphics Project of ACCAD was made part of the OSC structure. Researchers from OSGP set out to develop a visualization package based on the dataflow paradigm, and in 1988 the apE (animation production Environment) software was released. It was originally distributed free of charge to any users who wanted to use it, and it allowed for these users to write their own modules to extend the capabilities.
In 1991 OSC decided to commercialize this popular free software, and contracted with Taravisuals, Inc. to maintain and distribute it. Unfortunately, at about the same time, Iris Explorer was released and was freely bundled with the SGI workstation, one of the more popular apE platforms, and the apE effort was discontinued.
Like most of the other systems of the time, Data Explorer (DX) was a general-purpose visualization application in which the user created visualizations by combining existing modules into a network. It was discipline independent and easily adaptable to new applications and data. The program provided a full set of tools for manipulating, transforming, processing, realizing, rendering and animating data.
-
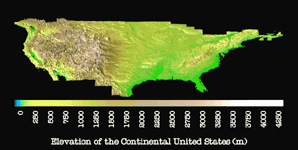
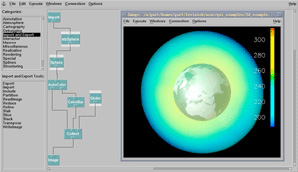
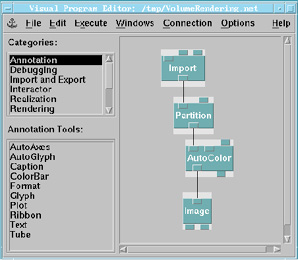
- Screenshots from Data Explorer
-
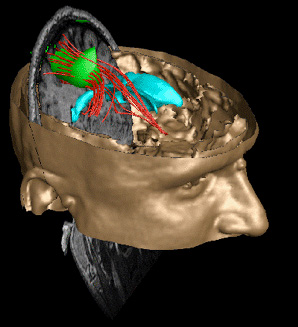
- Registered 3D MRI and Magnetoencephalographic Scans – NYU Medical Center
DX used visual programming and a data flow approach to visualization and analysis. The data flow modules were connected together to direct the data flow. This was analogous to creating a flow chart, and the resulting diagrams were called networks.
Users could work solely with the modules that came with Data Explorer or they could create macros. A macro was a network that was named and used in place of a module. There grew a large public collection of these macros that users could download.
DX provided visualization and analysis methods based on points, lines, areas, volumes, images or geometric primitives in any combination. It worked with 1-, 2-, and 3-dimensional data and with data which was rectangularly gridded, irregularly gridded, gridded on a non-rectangular grid, or scattered.
B. Lucas et al. An architecture for a scientific visualization system. In Proceedings of Visualization ’92, pages 107–114. IEEE Computer Society Press, 1992
Craig Upson, et al, The Application Visualization System: A Computational Environment for Scientific Visualization, IEEE CG&A, July 1989, pp 30-42
G.J. Edwards. The design of a second generation visualization environment. In J.J. Connor, S. Hernandez, T.K.S. Murthy, and H. Power, editors, Visualization and Intelligent Design in Engineering and Architecture, pages 3-16.
D. Scott Dyer. A dataflow toolkit for visualization. IEEE Computer Graphics and Applications, 10(4):60–69, July 1990
